Illinois House Passes Historic Climate Bill To Boost Economy

Illinois set to remain regional leader in clean energy job growth through bold renewable energy policies, funding for workforce training and equity SPRINGFIELD, IL  – Last night the Illinois House passed energy legislation that makes Illinois the first state in the Midwest to commit to 100% carbon-free power by 2045. This critical step for Illinois’ […]

District-By-District | Clean Jobs California 2021

Date: August 20, 2021

Clean Jobs California | District-By-District

According to E2’s analysis, as of 2021 more than 484,000 Californians worked in clean energy and more than $102 billion in public and private clean energy related investments have been injected into the state. California’s climate policies – including its leading Renewables Portfolio Standard and transportation electrification policies such as Advanced Clean Trucks (ACT) rule and the Advanced Clean Cars (ACC) program – are key to this economic growth and future growth as well.

California’s Statewide 2021 Clean Energy Jobs Report
Who Are My Representatives?

Almost 50 percent of the $8.3 billion in clean energy investments from California’s Greenhouse Gas Reduction Funds have benefited disadvantaged and low-income communities and households across the state. The state’s climate policies funded by the Greenhouse Gas Reduction Fund have cut emissions by the equivalent of taking 14 million cars off the road.

How to Download: Use the tables below to locate and download all 120 factsheets for every California state legislative district. Each factsheet details out the district-specific jobs and economic impact resulting from California’s climate policies.

California State Senate

California State Assembly

District Assembly Member
District 1Megan Dahle
District 2Jim Wood
District 3James Gallagher
District 4Cecilia Aguiar-Curry
District 5Frank Bigelow
District 6Kevin Kiley
District 7Kevin McCarty
District 8Ken Cooley
District 9Jim Cooper
District 10Marc Levine
District 11Jim Frazier
District 12Heath Flora
District 13Carlos Villapudua
District 14Tim Grayson
District 15Buffy Wicks
District 16Rebecca Bauer-Kahan
District 17David Chiu
District 18Vacant
District 19Phil Ting
District 20Bill Quirk
District 21Adam Gray
District 22Kevin Mullin
District 23Jim Patterson
District 24Marc Berman
District 25Alex Lee
District 26Devon Mathis
District 27Ash Kalra
District 28Evan Low
District 29Mark Stone
District 30Robert Rivas
District 31Joaquin Arambula
District 32Rudy Salas
District 33Thurston Smith
District 34Vince Fong
District 35Jordan Cunningham
District 36Tom Lackey
District 37Steve Bennett
District 38Suzette Martinez Valladares
District 39Luz M. Rivas
District 40James Ramos
District Assembly Member
District 41Chris Holden
District 42Chad Mayes
District 43Laura Friedman
District 44Jacqui Irwin
District 45Jesse Gabriel
District 46Adrin Nazarian
District 47Eloise Gómez Reyes
District 48Blanca Rubio
District 49Edwin Chau
District 50Richard Bloom
District 51Wendy Carrillo
District 52Freddie Rodriguez
District 53Miguel Santiago
District 54Isaac Bryan
District 55Phillip Chen
District 56Eduardo Garcia
District 57Lisa Calderon
District 58Cristina Garcia
District 59Reginald Byron Jones-Sawyer, Sr.
District 60Sabrina Cervantes
District 61Jose Medina
District 62Autumn Burke
District 63Anthony Rendon
District 64Mike Gipson
District 65Sharon Quirk-Sirva
District 66Al Muratsuchi
District 67Kelly Seyarto
District 68Steven Choi
District 69Tom Daly
District 70Patrick O’Donnell
District 71Randy Voepel
District 72Janet Nguyen
District 73Laurie Davies
District 74Cottie Petrie-Norris
District 75Marie Waldron
District 76Tasha Boerner Horvath
District 77Brian Maienschein
District 78Christopher Ward
District 79Akilah Weber
District 80Lorena Gonzalez

Looking for More Info?

For more information on the source and methodology used to compile the numbers on this sheet, please see Understanding The Numbers or visit https://e2.org/reports/caclimateleadership/sources.

Statewide Jobs Report

For details on clean energy’s statewide impact on jobs in California, including data at the county, metro, congressional district levels, and for details by subsector and value chain, visit E2’s Clean Jobs California 2021 report page.

U.S. Energy & Employment Report (USEER)

This district-by-district report follows E2’s Clean Jobs America analysis which found the clean energy jobs account for over 3 million jobs across all 50 states and the District of Columbia. Both reports expand on data from the U.S. Energy and Employment Report (USEER) produced by the Energy Futures Initiative (EFI) in partnership with the National Association of State Energy Officials (NASEO), using data collected and analyzed by the BW Research Partnership. E2 is a partner on the USEER, the fifth installment of the energy survey first released by the Department of Energy in 2016. Additional methodology on the private and public investment number and Greenhouse Gas Reduction Fund investments can be found in our About The Numbers reference document.

For additional information, visit e2.org/reports or contact E2 communications director Michael Timberlake at ([email protected]). An FAQ is also available here.

View Report »

Penn. Makes Largest State Purchase of Solar Power

Harrisburg, P.A.  – Pennsylvania will be making the single-largest solar procurement by a state government in the country, Governor Tom Wolf announced today. The block of solar power purchasing agreements will supply about 50% of the state government’s electricity demands, exceeding the commitment made in the governors’ 2019 executive order. The following is a statement […]

Clean Jobs Washington 2020

Date: November 24, 2020

Primed to Lead Washington’s Economic Recovery

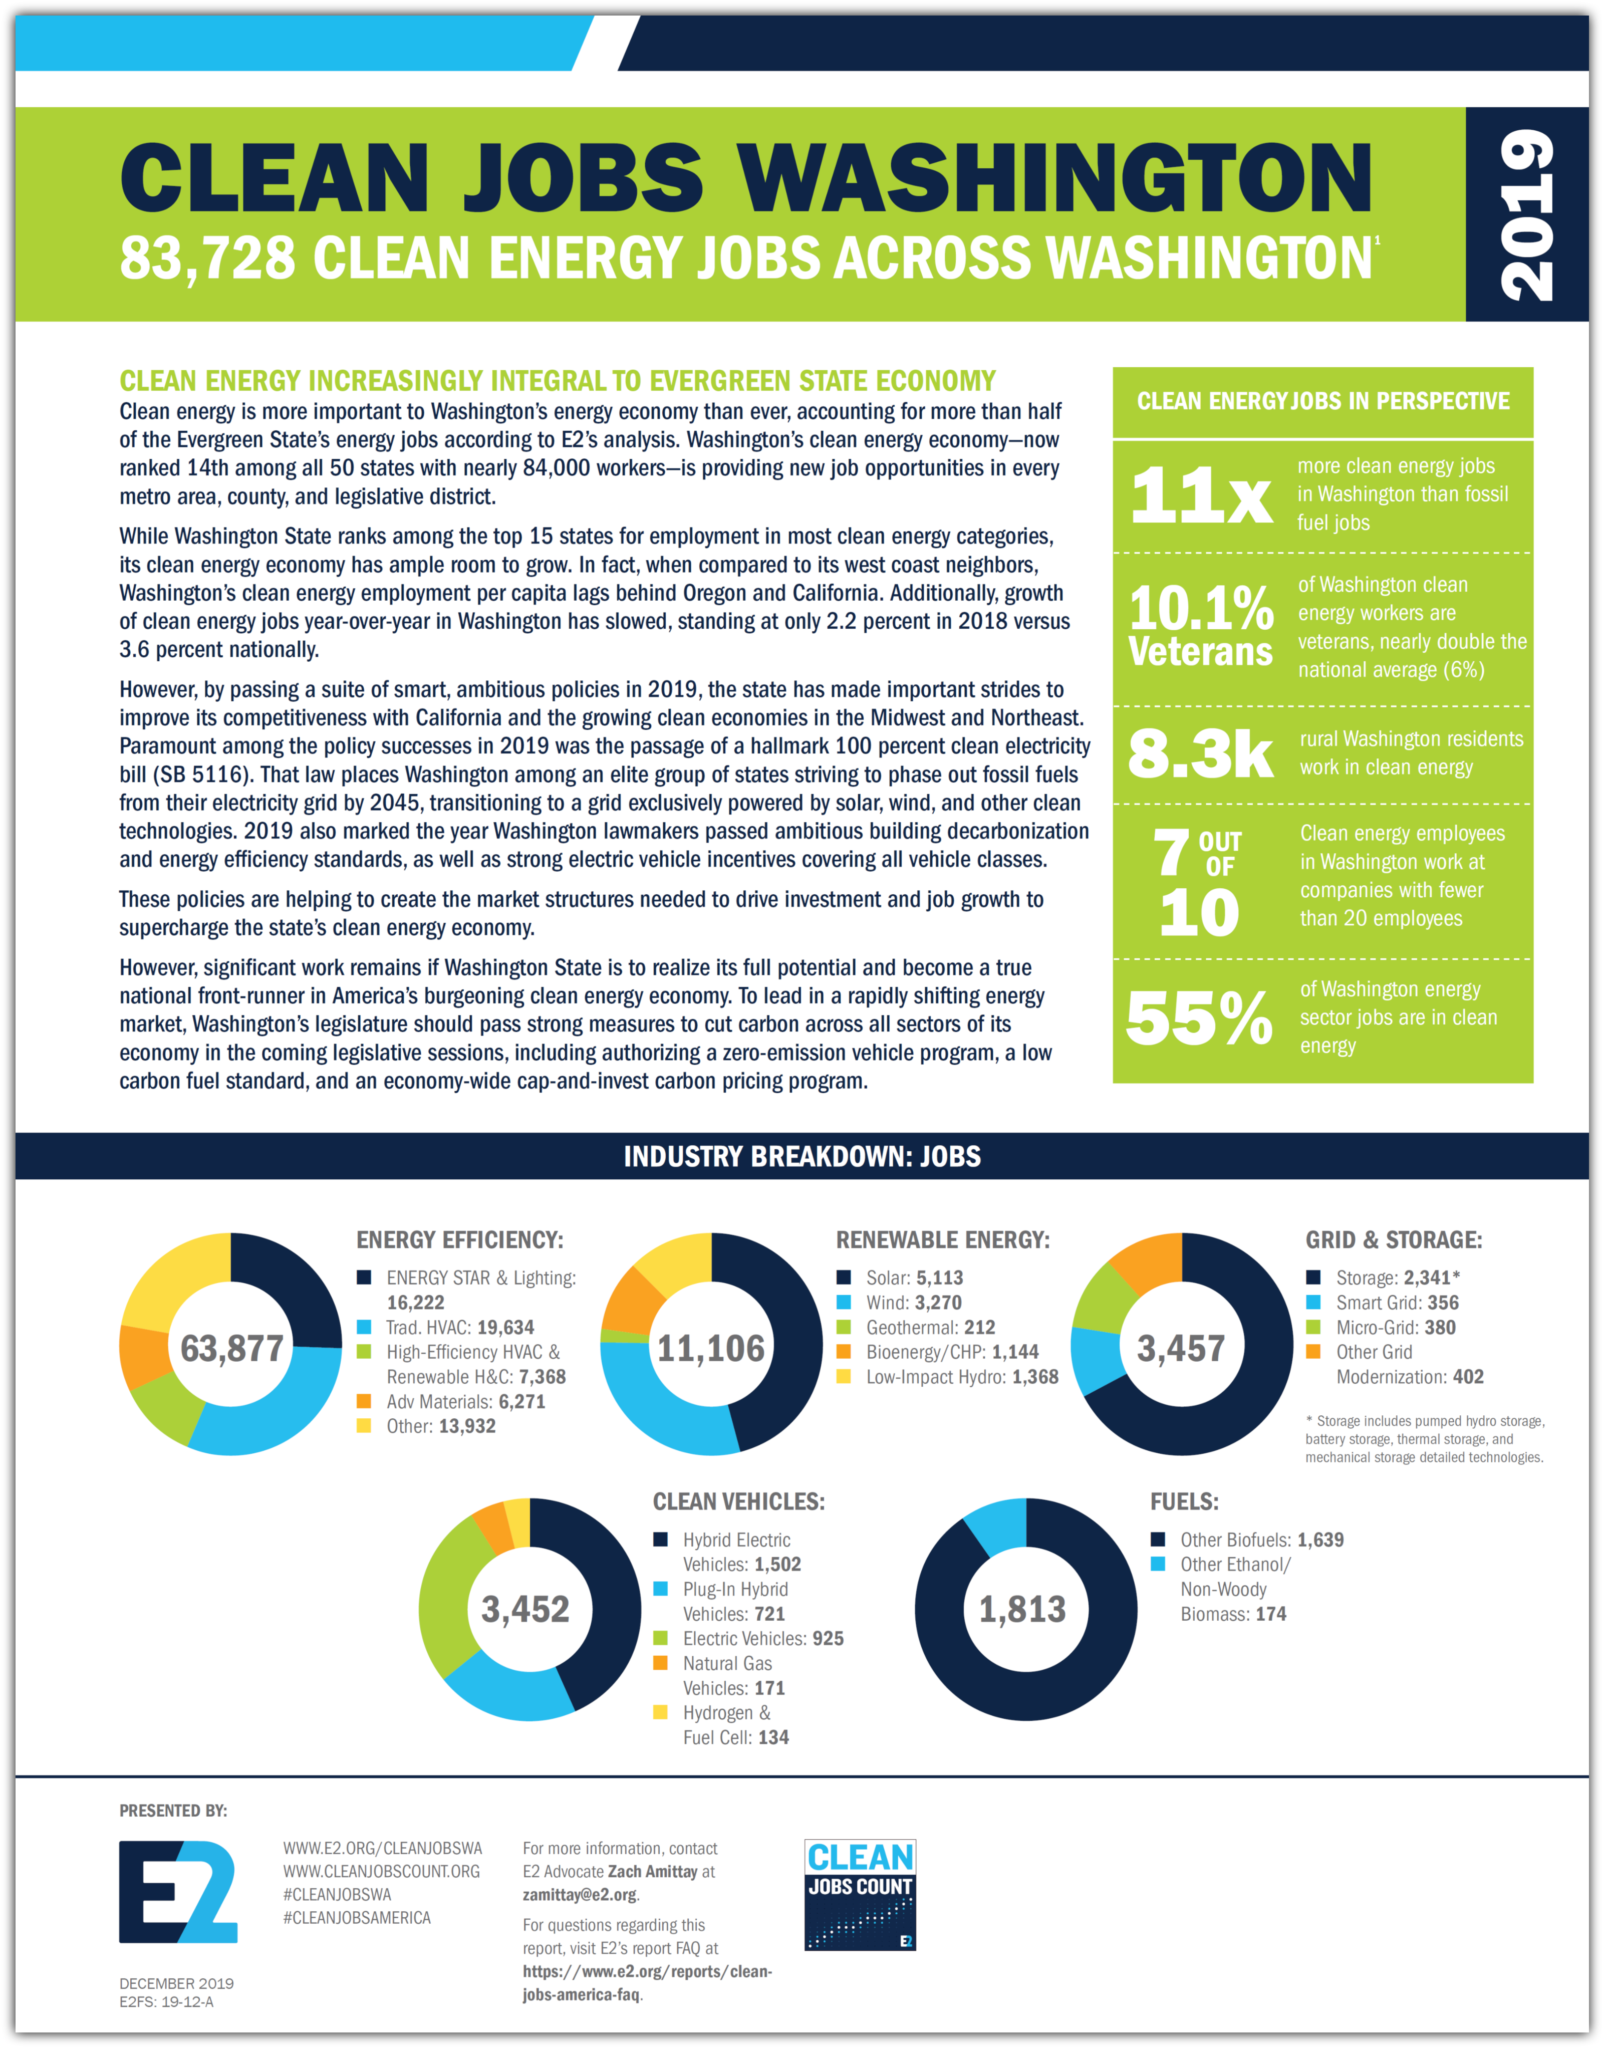
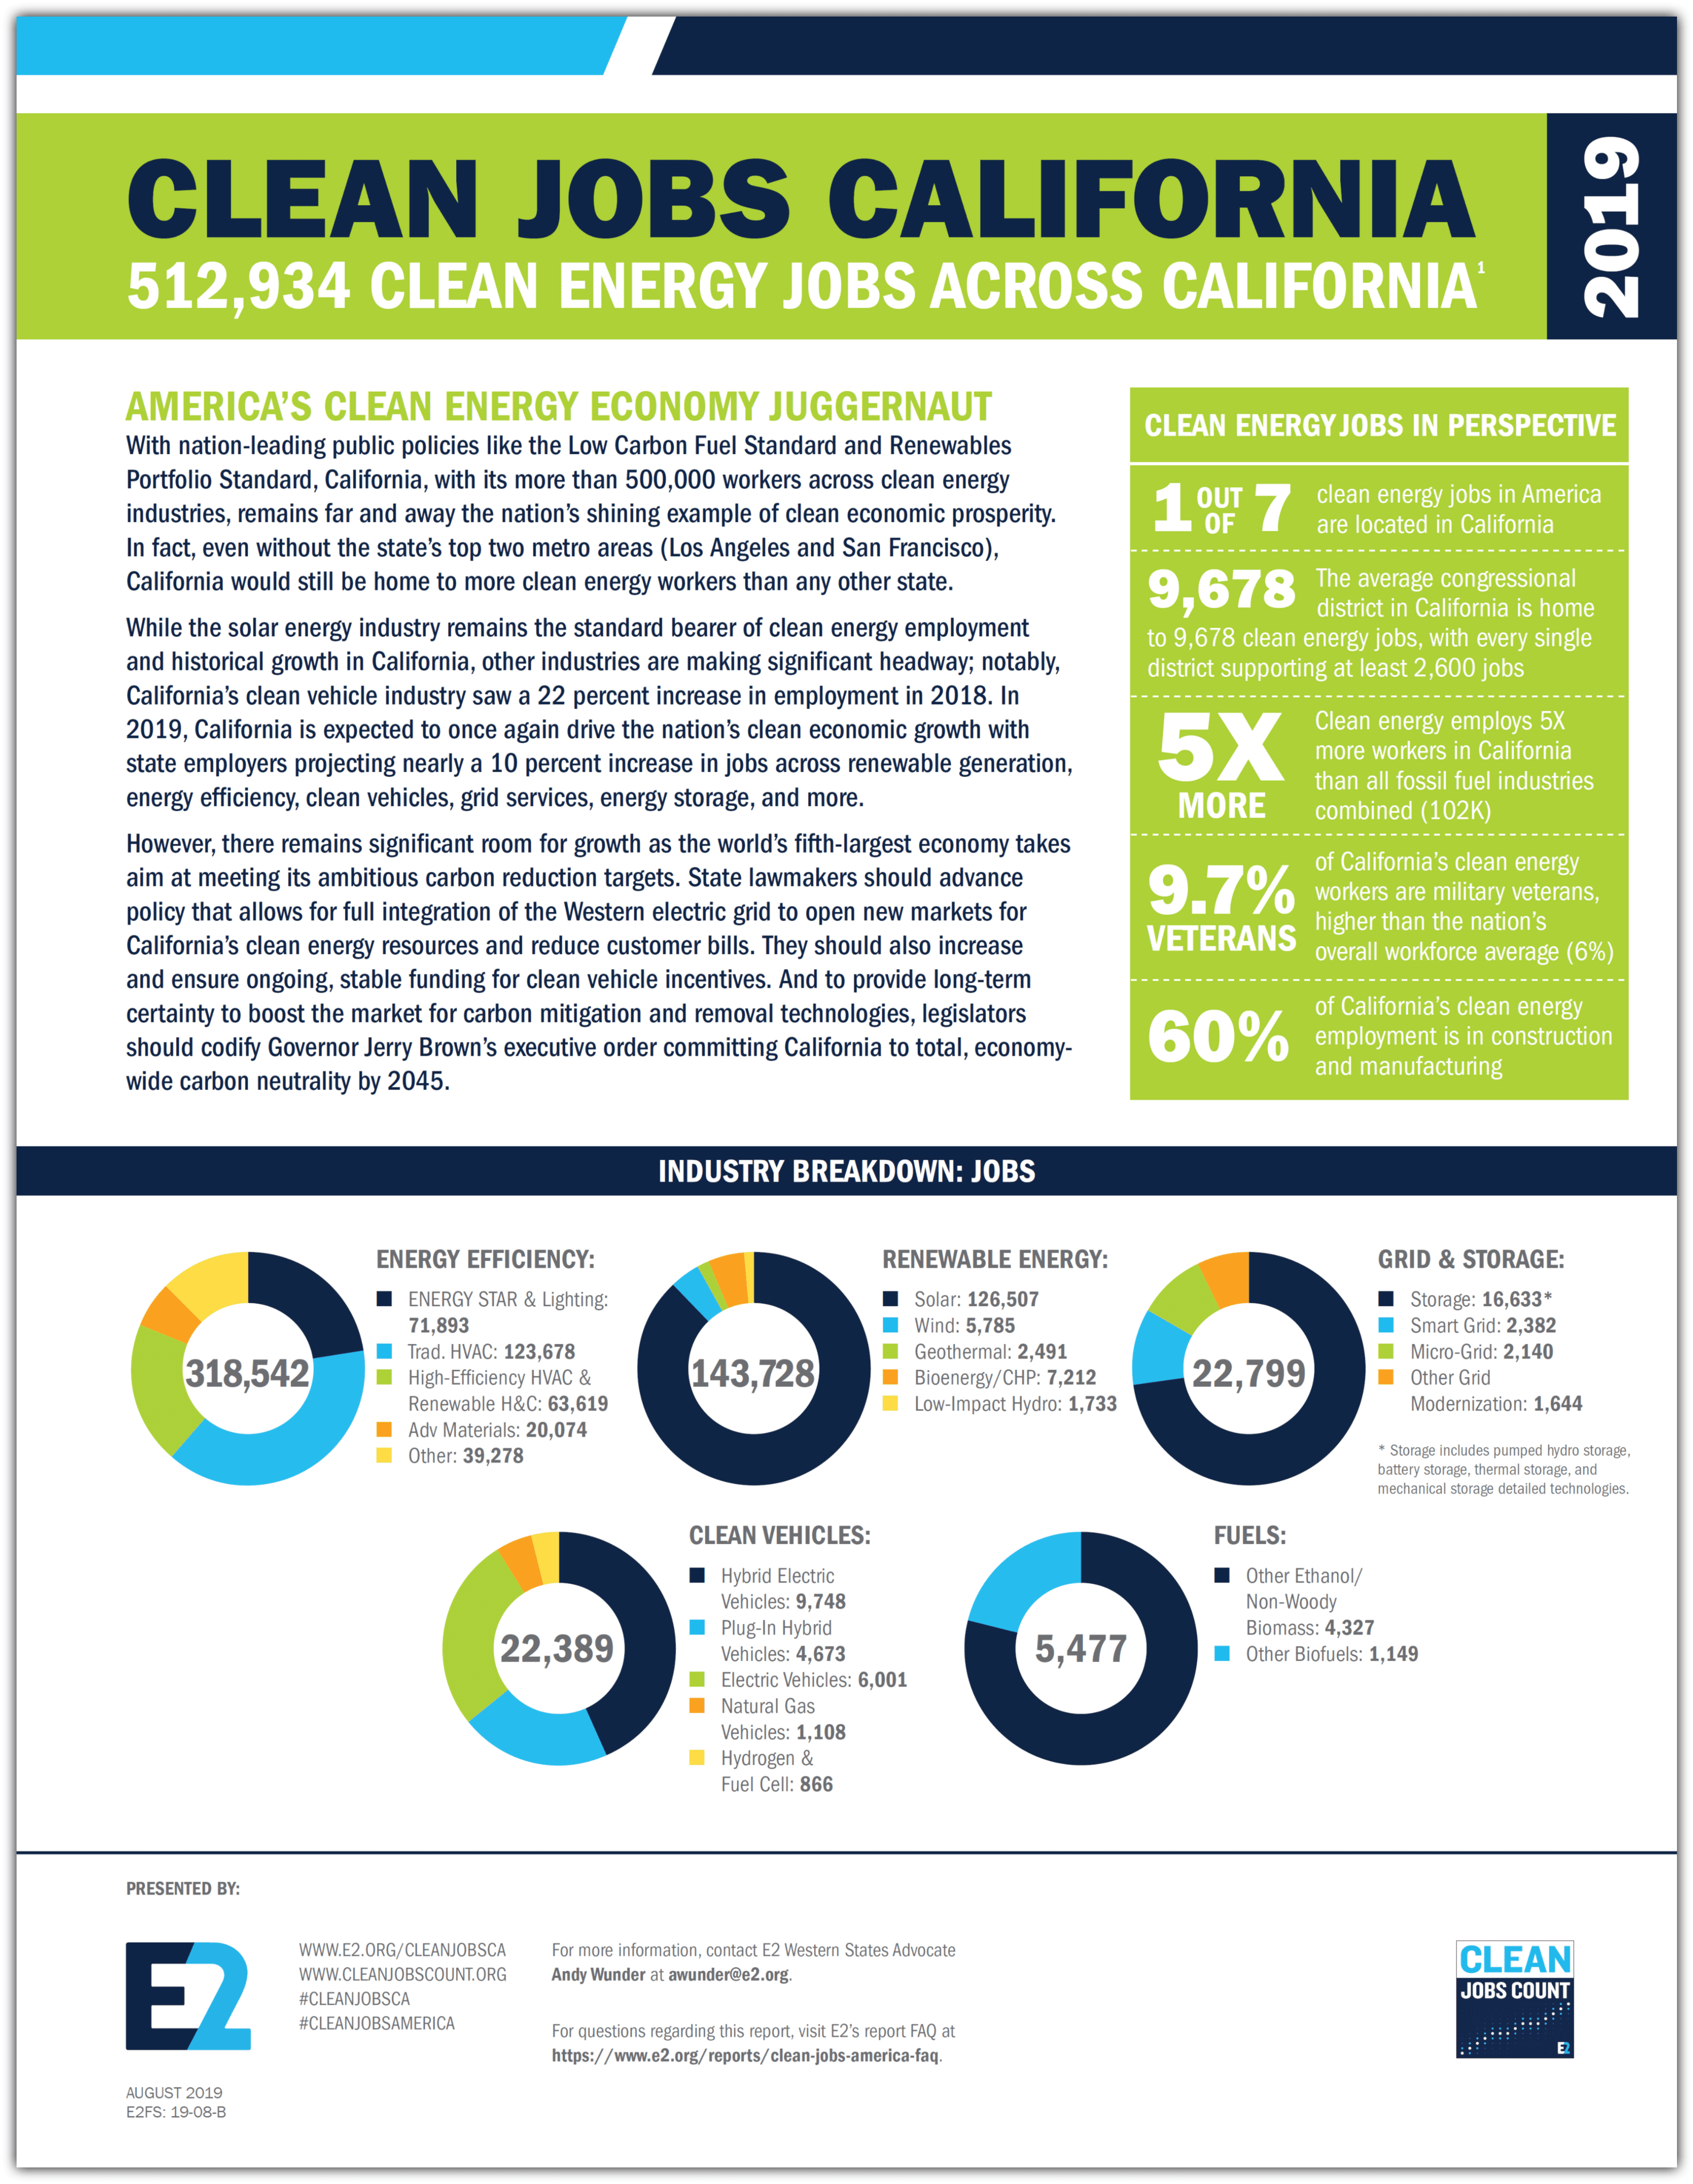
At the onset of 2020, Washington’s clean energy economy was coming off another year of solid growth, further establishing itself as the backbone—and future—of the Evergreen State’s energy sector. With more than 85,000 clean energy workers, the state ranked 13th for clean energy employment. Illustrating the important role this sector plays in Washington’s economy, the clean energy industry accounts for more than 25% of all construction jobs in the state. Importantly, these jobs’ wages and benefits compare favorably to other industries; E2’s recent Clean Jobs, Better Jobs report shows that the median wage for Washington’s clean energy economy pays nearly 11% more than the state’s overall median wage.

But following five straight years of job growth, Washington’s clean energy economy has been derailed by the economic recession driven by COVID-19. state policymakers have a central role to play as well. Tremendous job creation can be delivered by staying the course on implementation of existing clean energy policy, prime among them Washington’s Clean Energy Transformation Act. To ensure continued recovery and economic development in the years to come, state lawmakers should adopt additional policies in 2021 to drive investment and job growth in the clean energy economy. These policy opportunities—including a clean fuels program, clean truck standards, a state-wide limit on carbon pollution, and carbon pricing—can drive strong investments in climate solutions across the state. If well-designed, these and other policies have the potential to leverage Washington’s clean energy economy as an engine for broader economic recovery. Through October, more than 17,000 clean energy workers—almost one-fifth of Washington’s clean energy workforce pre-COVID—remain out of work.

Clean Jobs Washington 2020 comes at a critical juncture in the state’s efforts to recover from the COVID-19 health and economic crises. With the Washington state Legislature set to reconvene in January, policymakers will have the opportunity to leverage clean energy as an engine for broader economy recovery by enacting policies to get clean energy back on its growth trajectory. Policies such as a clean fuels program, clean truck standards, a state-wide limit on carbon pollution, and carbon pricing can drive investments in climate solutions and bring robust economic growth across the state.

This report details the size, scope, and diversity of this core Washington state employment sector, the troubles it is currently facing due to the pandemic, and the promise that strategic policy direction and stimulus investments in clean energy hold to drive a durable and sustainable recovery for Washington’s economy. In addition to detailing sector-by-sector employment, Clean Jobs Washington 2020 also breaks down jobs at the city, county, legislative and congressional district levels. See more details here.

A BIGGER PICTURE

This report focuses solely on the energy sector of the economy and does not include jobs in retail trade, repair services, water or waste management, and indirect employment or induced employment.

WASHINGTON CLEAN JOB EMPLOYMENT Q4 2019

  • Energy Efficiency – 64,930 jobs
  • Renewable Energy – 11,189  jobs
  • Solar Energy – 5,081 jobs
  • Clean Vehicles – 3,351 jobs
  • Wind Energy – 3,310 jobs
  • Energy Storage – 2,451 jobs
  • Clean Fuels – 1,936 jobs
  • Grid Modernization – 1,176 jobs
  • ALL Clean Energy Sectors – 85,035 jobs

OTHER FINDINGS

  • Small businesses are the backbone of Washington’s clean energy economy. More than two out of every three (69%) clean energy workers were employed at companies with fewer than 20 workers;
  • 1 in 4 construction jobs in Washington are in clean energy occupations, from solar installers and site workers to electricians, HVAC technicians, lighting technicians, carpenters and others who work in energy efficiency;
  • Washington ranked in the top 15 for jobs in 12 sectors and subsectors in 2019 – helping the state diversify jobs growth across the clean energy economy;
  • Clean energy accounts for 55% of all energy sector jobs in Washington and made up 74% of the sector’s total job growth in 2019;

DOWNLOAD

The complete report is available for download at this link.

Previous Reports

Looking For More Info?

This report follows E2’s Clean Jobs America analysis which found the clean energy jobs account for nearly 3.3 million jobs across all 50 states and the District of Columbia. Both reports expand on data from the U.S. Energy and Employment Report (USEER) produced by the Energy Futures Initiative (EFI) in partnership with the National Association of State Energy Officials (NASEO), using data collected and analyzed by the BW Research Partnership. E2 is a partner on the USEER, the fifth installment of the energy survey first released by the Department of Energy in 2016.

If you are looking for additional insight into E2’s Clean Jobs Washington 2019 or our other Clean Jobs America reports, visit e2.org/reports. You can also contact E2 Communications Director Michael Timberlake ([email protected]). An FAQ is also available here to answer any questions.

View Report »

Clean Jobs Pennsylvania 2020

Date: September 23, 2020

Pennsylvania’s Key To Economic Recovery

In 2019, clean energy jobs in Pennsylvania increased for the seventh straight year since E2 began releasing annual clean energy jobs reports in the state, growing to nearly 94,000 workers statewide before the effects of the coronavirus outbreak impacted the nation’s economy. A regional and national leader in clean energy jobs, Pennsylvania ranked just outside the top ten (11th) for total clean energy jobs among all 50 states and the District of Columbia for the third year in a row. Since 2017, the state has added more new jobs (8,253) than six of the current top ten states and now trails No. 10 Virginia by fewer than 3,500 workers.

Despite its large workforce size, recent years of strong growth and consistent high performance across clean technologies, Pennsylvania’s clean economy is underperforming its potential, as the state’s clean energy workforce still makes up a lower share of total statewide jobs than the national average. Growth in recent years has been driven primarily by energy efficiency, solar energy, and grid modernization—high growth areas for the future that will be important as the state’s economy faces its toughest test as the nation reels and rebuilds after the impact of COVID-19 economic shutdowns.

E2, the Keystone Energy Efficiency Alliance (KEEA), the Green Building Alliance (GBA), Green Building United, the Sustainable Business Network of Greater Philadelphia, and Sustainable Pittsburgh’s Clean Jobs Pennsylvania 2020 details the size, scope, and diversity of this important employment sector, the troubles it is currently facing due to the pandemic, and how focusing recovery policies on clean energy can get struggling Pennsylvania workers and businesses back on track and the state’s economy up and running again for the long run.

INDUSTRY JOB TOPLINES | Q4 2019

  • Energy Efficiency – 71,443 jobs
  • Renewable Energy – 9,744 jobs
    • Solar Energy – 5,173 jobs
    • Wind Energy – 2,937 jobs
  • Clean Vehicles – 7,541 jobs
  • Clean Storage – 1,770  jobs
  • Grid Modernization – 1,929  jobs
  • Clean Fuels – 1,436 jobs
  • ALL Clean Energy Sectors – 93,861 jobs

DOWNLOAD

The complete report is available for download at this link.

Looking for More Info?

The analysis expands on data from the 2020 U.S. Energy and Employment Report (USEER) produced by the Energy Futures Initiative (EFI) in partnership with the National Association of State Energy Officials (NASEO), using data collected and analyzed by the BW Research Partnership. The report was released in March 2020and is available at www.usenergyjobs.org. E2 is a partner on the USEER, the fifth installment of the energy survey first released by the Department of Energy in 2016 and subsequently abandoned under the Trump administration. Clean energy jobs have grown every year since the first report was released in 2016.

If you are looking for additional insight into E2’s Clean Jobs Pennsylvania 2020 or our other Clean Jobs America reports, visit e2.org/reports. You can also contact E2 Communications Director Michael Timberlake ([email protected]). An FAQ is also available here to answer any questions.

PAST CLEAN JOBS PENNSYLVANIA REPORTS

Clean Jobs Pennsylvania 2020 is the 5th statewide clean energy jobs report from E2. Previous reports can be accessed in the below links.

E2 MONTHLY UNEMPLOYMENT REPORTS

View Report »

Report: Clean Energy Employed 94,000 in PA Before Pandemic, 50K More than Fossil Fuels

PA was home to 11th most clean energy jobs before COVID-19 Jobs in renewables grew 11.8% from 2017-2019 as natural gas employment dropped 10% 18,000 jobs lost since COVID-19, wiping out 19% of industry’s workforce Pittsburgh (September 23, 2020) – Led by strong growth in solar energy, grid modernization, and energy efficiency, Pennsylvania added more […]

Time is Now to Embrace Clean Energy, House Dems Climate Action Plan

WASHINGTON – The House Select Committee on the Climate Crisis called on the need for investments in the clean energy economy, making it a focal point of the Committee’s Climate Crisis Action Plan released today. If enacted, the Plan would achieve net zero carbon emissions in the U.S. by 2050. Addressing climate change by unlocking […]

Clean Jobs Washington 2019

Date: December 18, 2019

Clean Energy Economy Integral to Evergreen State

Clean energy is increasingly integral to Washington’s economic growth, as more than five out of every ten jobs in the Evergreen State’s energy economy are now in clean energy industries.  

Led by energy efficiency (63K) and renewable energy (11K), Washington’s clean energy economy—now ranked 14th among all 50 states with nearly 84,000 workers—is providing new job opportunities in every metro area, county, and legislative district.While Washington State ranks among the top 15 states for employment in most clean energy categories, its clean energy economy has ample room to grow. In fact, when compared to its west coast neighbors, Washington’s clean energy employment per capita lags behind Oregon and California.

However, by passing a suite of smart, ambitious policies in 2019, the state has made important strides to improve its competitiveness with California and the growing clean economies in the Midwest and Northeast. Paramount among the policy successes in 2019 was the passage of a hallmark 100 percent clean electricity bill (SB 5116).

But significant work remains if Washington State is to realize its full potential and become a true national front-runner in America’s burgeoning clean energy economy. To lead in a rapidly shifting energy market, Washington’s legislature should pass strong measures to cut carbon across all sectors of its economy in the coming legislative sessions, including authorizing a zero-emission vehicle program, a low carbon fuel standard, and an economy-wide cap-and-invest carbon pricing program.

A BIGGER PICTURE

This report focuses solely on the energy sector of the economy and does not include jobs in retail trade, repair services, water or waste management, and indirect employment or induced employment.

HOW WASHINGTON STACKS UP NATIONALLY

Washington ranks among the top 15 states for employment in 10 clean energy categories.

  • #11 Total Renewable energy
  • #13 Energy Efficiency
  • #6 Clean Storage
  • #11 Geothermal
  • #12 Bioenergy
  • #3 Small Hydropower
  • #10 Wind Energy
  • #2 Other Biofuels
  • #12 Total Transmission, Storage & Distribution
  • #14 Total Clean Energy

WASHINGTON CLEAN JOB SECTOR TOPLINES

  • Energy Efficiency – 63,877 jobs
  • Renewable Energy – 11,106 jobs
  • Solar Energy – 5,113 jobs
  • Clean Vehicles – 3,452 jobs
  • Wind Energy – 3,270 jobs
  • Energy Storage – 2,341 jobs
  • Clean Fuels – 1,813 jobs
  • Grid Modernization – 1,138 jobs
  • ALL Clean Energy Sectors – 83,728 jobs

HIGHLIGHTS

According to Clean Jobs Washington 2019:

  • Seven out of every ten (69.9%) clean energy workers are employed by businesses with fewer than 20 total employees.
  • Construction (64.3%) accounts for the majority of clean energy jobs.
  • If counted as a single metro area, Washington’s rural areas rank second in the state for clean energy jobs, behind only the Seattle-Tacoma-Bellevue metro.
  • 3,457 Washington residents now work in grid modernization (1,138) and energy storage (2,341)
  • 10.1% of Washington residents employed in clean energy are veterans, nearly double the national average (6%).
  • Of the top 10 counties by clean energy jobs per capita, five have populations under 100,000.
  • Washington’s clean vehicle job growth (21.4%) outpaced the sector’s national average (15.4%)
  • Clean energy employs 11X more Washington residents all fossil fuels combined (7,304).
  • 55% of Washington energy sector employees  (153,425) work in clean energy (83,728)
  • Less than 12,000 jobs separates Washington (#14) from the #10 state for clean energy employment (Virginia)
  • 45% of Washington’s clean energy jobs are based outside the Seattle metro area

DOWNLOAD

The complete report is available for download at this link.

Looking For More Info?

U.S. Energy & Employment Report (USEER)

This report follows E2’s Clean Jobs America analysis which found the clean energy jobs account for nearly 3.3 million jobs across all 50 states and the District of Columbia. Both reports expand on data from the U.S. Energy and Employment Report (USEER) produced by the Energy Futures Initiative (EFI) in partnership with the National Association of State Energy Officials (NASEO), using data collected and analyzed by the BW Research Partnership. E2 is a partner on the USEER, the fourth installment of the energy survey first released by the Department of Energy in 2016. Clean energy jobs have grown every year since the first report was released in 2016.

If you are looking for additional insight into E2’s Clean Jobs California 2019 or our other Clean Jobs America reports, visit e2.org/reports. You can also contact E2 Communications Director Michael Timberlake ([email protected]). An FAQ is also available here to answer any questions.

Other E2 Clean Jobs Reports

Clean Jobs Washington is only one in a series of state and industry reports produced by E2 and our partners.

View Report »

District-By-District | Clean Jobs Oregon 2019

Date: November 20, 2019

Clean Jobs Oregon| District-By-District

According to an analysis of every Oregon state senate district, more than 55,400 Oregonians now work in clean energy industries and more than $6.7 billion has been invested in wind and solar energy projects – generating $258 million in public revenue.

Oregon’s Statewide 2019 Clean Energy Jobs Report
Who Are My Representatives?

This job growth and development has been driven by smart policies like the Renewable Portfolio Standard, Clean Fuels Program and Coal to Clean.

But this growth is only scratching the surface of what Oregon’s clean energy economy can achieve according to this latest analysis. By passing the state a cap and invest program during the 2020 legislative cycle, Oregon could nearly double its total clean energy jobs (adding 50,000), increase real GDP 2.5% by 2050, and generate $4.5 billion in proceeds to be invested in communities throughout Oregon by 2030.

To learn more about the current economic benefits clean energy is providing in every Oregon senate district, click on the Senator’s name and district linked in the below table.

How to Download: Use the tables below to locate and download all 30 factsheets for every Oregon state senate district. Each factsheet details out the district-specific jobs and economic impact resulting from Oregon’s climate policies.

Oregon State Senate

Looking for More Info?

Statewide Jobs Report

For details on clean energy’s statewide impact on jobs in California, including at the county and metro levels, breakdowns for each clean tech subsector, by congressional districts, and information on how the jobs spread across the state’s value chain, visit E2’s Clean Jobs Oregon 2019 report page to download .

U.S. Energy & Employment Report (USEER)

This district-by-district report follows E2’s Clean Jobs America analysis which found the clean energy jobs account for nearly 3.3 million jobs across all 50 states and the District of Columbia. Both reports expand on data from the U.S. Energy and Employment Report (USEER) produced by the Energy Futures Initiative (EFI) in partnership with the National Association of State Energy Officials (NASEO), using data collected and analyzed by the BW Research Partnership. E2 is a partner on the USEER, the fourth installment of the energy survey first released by the Department of Energy in 2016. Clean energy jobs have grown every year since the first report was released in 2016.

If you are looking for additional insight into E2’s District-by-District | Clean Jobs California 2019 or our other Clean Jobs America reports, visit e2.org/reports. You can also contact E2 Communications Director Michael Timberlake ([email protected]). An FAQ is also available here to answer any questions.

Other Clean Jobs Reports

District-by-District | Clean Jobs Oregon 2019 is only one in a series of state and industry reports produced by E2 and our partners.

View Report »

Clean Jobs California 2019

Date: August 20, 2019

America’s Clean Energy Economy Juggernaut

With nation-leading public policies like the Low Carbon Fuel Standard and Renewables Portfolio Standard, California, with its more than half a million workers across clean energy industries, remains far and away the nation’s shining example of clean economic prosperity. Across all states, California supports one out of every seven U.S. clean energy jobs, four out of every ten U.S. solar energy jobs,  and one more than one out of every four U.S. renewable generation jobs. In fact, California’s is home to more renewable generation jobs than the next top six states combined and twice as many energy efficiency jobs as the no. 2 state (Texas).

While the solar energy industry remains the standard bearer of clean energy employment and historical growth in California, other industries are making significant headway; notably, California’s clean vehicle industry saw a 22 percent increase in employment in 2018. In 2019, California is expected to once again drive the nation’s clean economic growth with state employers projecting nearly a 10 percent increase in jobs across renewable generation, energy efficiency, clean vehicles, grid services, energy storage, and more.

Combined with this market domination, big opportunities remain as the world’s fifth-largest economy takes aim at meeting its ambitious carbon reduction targets.

A BIGGER PICTURE

This report focuses solely on the energy sector of the economy and does not include jobs in retail trade, repair services, water or waste management, and indirect employment or induced employment.

California Job Sector Toplines

  • Energy Efficiency – 318,542 jobs
  • Renewable Energy – 143,728 jobs
  • Solar Energy – 126,507 jobs
  • Clean Vehicles – 22,389 jobs
  • Energy Storage – 16,633 jobs
  • Bioenergy/CHP – 7,212 jobs
  • Grid Modernization – 6,166 jobs
  • Wind Energy – 5,785 jobs
  • Clean Fuels – 5,477 jobs
  • ALL Clean Energy Sectors – 512,934 jobs

Highlights

According to Clean Jobs California:

  • Clean energy employs five times more Californians than all fossil fuels combined (110,000)
  • More than 57% of California clean energy workers are employed by businesses with fewer than 20 employees
  • If included in E2’s state rankings, Los Angeles and San Francisco metro areas would rank no. 5 and no. 10 respectively. If combined, the two metros would be the no. 2 state for clean energy jobs in the U.S.
  • Clean vehicle technologies is the only industry California does not rank first in for jobs, trailing Michigan by fewer than 3,000 jobs
  • Nearly four out of every ten U.S. solar jobs are in California
  • Californian clean energy employers project nearly 10% growth in jobs in 2019
  • Bioenergy and combined heat and power made up the second most renewable generation jobs (7,212), followed by wind (5,785)
  • Construction (50.7%) accounts for half of California’s clean energy jobs.
  • 22,800 Californians now work in grid modernization (6,166) and energy storage (16,633)
  • 9.7 % of Californians employed in clean energy are veterans – far above the national average (6%)

DOWNLOAD

The complete report is available for download at this link.

Looking For More Info?

District-By-District Economic Impact

For details on clean energy’s overall economic impact in California, visit E2’s District-By-District: Clean Jobs California 2019  report page to download 120 individual factsheets for all 120 state legislative districts. The factsheets detail the investments in clean energy, jobs created, emissions, reduced, and cap and trade funds implemented in each district.

U.S. Energy & Employment Report (USEER)

This report follows E2’s Clean Jobs America analysis which found the clean energy jobs account for nearly 3.3 million jobs across all 50 states and the District of Columbia. Both reports expand on data from the U.S. Energy and Employment Report (USEER) produced by the Energy Futures Initiative (EFI) in partnership with the National Association of State Energy Officials (NASEO), using data collected and analyzed by the BW Research Partnership. E2 is a partner on the USEER, the fourth installment of the energy survey first released by the Department of Energy in 2016. Clean energy jobs have grown every year since the first report was released in 2016.

If you are looking for additional insight into E2’s Clean Jobs California 2019 or our other Clean Jobs America reports, visit e2.org/reports. You can also contact E2 Communications Director Michael Timberlake ([email protected]). An FAQ is also available here to answer any questions.

Other E2 Clean Jobs Reports

Clean Jobs California is only one in a series of state and industry reports produced by E2 and our partners.

View Report »

District-By-District | Clean Jobs California 2019

Date: August 20, 2019

Clean Jobs California | District-By-District

According to an analysis of every California legislative district released by E2 in August 2019, more than 512,000 Californians now work in clean energy industries, and more than $66 billion in public and private clean energy economy investments have been injected into the state. This job growth and investment is driven by California’s climate policies, including its leading Renewables Portfolio Standard and landmark cap-and-trade legislation, which reduces pollution while increasing clean energy production and energy efficiency.

California’s Statewide 2019 Clean Energy Jobs Report
Who Are My Representatives?

The state’s climate policies also have cut emissions by the equivalent of taking 22 million cars off the road and 57 percent of the $3.4 billion in clean energy investments stemming from cap-and-trade have gone specifically towards benefiting disadvantaged communities around the state.

How to Download: Use the tables below to locate and download all 120 factsheets for every California state legislative district. Each factsheet details out the district-specific jobs and economic impact resulting from California’s climate policies.

California State Senate

California State Assembly

District Assembly Member
District 1Vacant
District 2Jim Wood
District 3James Gallagher
District 4Cecilia Aguiar-Curry
District 5Frank Bigelow
District 6Kevin Kiley
District 7Kevin McCarty
District 8Ken Cooley
District 9Jim Cooper
District 10Marc Levine
District 11Jim Frazier
District 12Heath Flora
District 13Susan Talamantes-Eggman
District 14Tim Grayson
District 15Buffy Wicks
District 16Rebecca Bauer-Kahan
District 17David Chiu
District 18Rob Bonta
District 19Phil Ting
District 20Bill Quirk
District 21Adam Gray
District 22Kevin Mullin
District 23Jim Patterson
District 24Marc Berman
District 25Kansen Chu
District 26Devon Mathis
District 27Ash Kalra
District 28Evan Low
District 29Mark Stone
District 30Robert Rivas
District 31Joaquin Arambula
District 32Rudy Salas
District 33Jay Obernolte
District 34Vince Fong
District 35Jordan Cunningham
District 36S. Monique Limón
District 37Christy Smith
District 38Luz Maria Rivas
District 39James Ramos
District 40Chris Holden
District Assembly Member
District 41Chad Mayes
District 42Laura Friedman
District 43Jacqui Irwin
District 44Tom Lackey
District 45Jesse Gabriel
District 46Adrin Nazarian
District 47Eloise Gómez Reyes
District 48Blanca Rubio
District 49Edwin Chau
District 50Richard Bloom
District 51Wendy Carrillo
District 52Freddie Rodriguez
District 53Miguel Santiago
District 54Sydney Kamlager-Dove
District 55Phillip Chen
District 56Eduardo Garcia
District 57Ian C. Calderon
District 58Cristina Garcia
District 59Reginald Byron Jones-Sawyer, Sr.
District 60Sabrina Cervantes
District 61Jose Medina
District 62Autumn Burke
District 63Anthony Rendon
District 64Mike Gipson
District 65Sharon Quirk-Sirva
District 66Al Muratsuchi
District 67Melissa Melendez
District 68Steven Choi
District 69Tom Daly
District 70Patrick O’Donnell
District 71Randy Voepel
District 72Tyler Diep
District 73William Brough
District 74Cottie Petrie-Norris
District 75Marie Waldron
District 76Tasha Boerner Horvath
District 77Brian Maienschein
District 78Todd Gloria
District 79Shirley Weber
District 80Lorena Gonzalez Fletcher

Looking for More Info?

Statewide Jobs Report

For details on clean energy’s statewide impact on jobs in California, including at the county and metro levels, breakdowns for each clean tech subsector, by congressional districts, and information on how the jobs spread across the state’s value chain, visit E2’s Clean Jobs California 2019 report page to download .

U.S. Energy & Employment Report (USEER)

This district-by-district report follows E2’s Clean Jobs America analysis which found the clean energy jobs account for nearly 3.3 million jobs across all 50 states and the District of Columbia. Both reports expand on data from the U.S. Energy and Employment Report (USEER) produced by the Energy Futures Initiative (EFI) in partnership with the National Association of State Energy Officials (NASEO), using data collected and analyzed by the BW Research Partnership. E2 is a partner on the USEER, the fourth installment of the energy survey first released by the Department of Energy in 2016. Clean energy jobs have grown every year since the first report was released in 2016.

If you are looking for additional insight into E2’s District-by-District | Clean Jobs California 2019 or our other Clean Jobs America reports, visit e2.org/reports. You can also contact E2 Communications Director Michael Timberlake ([email protected]). An FAQ is also available here to answer any questions.

Other Clean Jobs Reports

District-by-District | Clean Jobs California 2019 is only one in a series of state and industry reports produced by E2 and our partners.

View Report »

Clean Jobs North Carolina 2019

Date: July 18, 2019

Top 10 in Jobs Across Clean Technologies

North Carolina is the Southeast’s leader in clean energy jobs. Not only does the Tar Heel state rank among the top 10 states in the country across clean energy categories such as solar energy, energy efficiency, and overall clean energy.

According to Clean Jobs North Carolina 2019 (downloadable PDF), the state’s clean energy jobs grew 3.5 percent last year – nearly double statewide employment growth (1.9%) —and now account for more than half of North Carolina’s entire energy sector workforce (212,172).  Clean vehicles led all sectors in growth, adding more than 1,000 jobs for a 19.5% growth rate.

Along with being a national pioneer in solar energy as the No 2. state for installed solar and No. 9 for jobs, North Carolina is fast becoming a powerhouse in energy efficiency as well with over 86,000 jobs – employing more workers in energy efficiency alone than 39 states do in all clean energy sectors.

All 100 counties in North Carolina—from Cherokee to Currituck—are home to residents who work in clean energy jobs, and 26 counties are home to at least 900 jobs. And while the metropolitan areas of Charlotte and Raleigh combine to make up the largest portion of the state’s clean jobs (37,700), its rural areas account for 25 percent of all the state’s jobs in renewable energy, efficiency, storage, and clean vehicles and fuels (29,000).

North Carolina Job Sector Toplines

  • Energy Efficiency – 86,559 jobs
  • Renewable Energy – 12,091 jobs
  • Solar Energy – 8,912 jobs
  • Clean Vehicles – 7,280 jobs
  • Grid Modernization – 2,124 jobs
  • Energy Storage – 1,692 jobs
  • Wind Energy – 908 jobs
  • ALL Clean Energy Sectors – 110,913 jobs

Other Highlights from 2018

  • Clean energy jobs also now employ more than ten times more workers than the state’s entire fossil fuel industry (10,022)
  • 80% of clean energy employers reported it was “very difficult” or “somewhat difficult” hiring qualified workers
  • More than 4 out of every 5 clean energy workers are employed by businesses with fewer than 20 employees
  • Construction (44.3%) and manufacturing (16.8%) make up the majority of clean energy jobs
  • 3,468 North Carolinians now work in grid modernization (2,124) and energy storage (1,344)
  • 11.4% of North Carolinians employed in clean energy are veterans – nearly double the percentage of veterans in the overall national workplace (6%)
  • 11 of North Carolina’s congressional districts are home to at least 5,000 clean jobs
  • 40 of the state’s 50 senate districts along with 39 house districts had over 1,000 clean energy jobs.
  • 26 of North Carolina’s 100 counties employ at least 900 clean energy workers
  • Mecklenburg led all counties in North Carolina with 20,142 jobs, followed by Wake (17,491) and Guilford (6,318) counties

Looking for More Info?

This report follows E2’s Clean Jobs America analysis which found the clean energy jobs account for nearly 3.3 million jobs across all 50 states and the District of Columbia. Both reports expand on data from the U.S. Energy and Employment Report (USEER) produced by the Energy Futures Initiative (EFI) in partnership with the National Association of State Energy Officials (NASEO), using data collected and analyzed by the BW Research Partnership. E2 is a partner on the USEER, the fourth installment of the energy survey first released by the Department of Energy in 2016. Clean energy jobs have grown every year since the first report was released in 2016.

If you are looking for additional insight into E2’s Clean Jobs North Carolina 2019 or our other Clean Jobs America reports, visit e2.org/reports. You can also contact E2 Communications Director Michael Timberlake ([email protected]). An FAQ is also available here to answer any questions.

DOWNLOAD

The complete report is available for download at this link.

OTHER CLEAN JOBS REPORTS

Clean Jobs North Carolina is only one in a series of state and industry reports produced by E2 and our partners.

View Report »

Sign Up for Email Updates


  • This field is for validation purposes and should be left unchanged.

Our Latest Press Releases


Releases

E2: Senate “Slams Brakes” on Made-in-USA Energy, Putting Projects, Jobs and Energy Security At Risk

WASHINGTON (July 1, 2025) – The U.S. Senate passed a massive tax and spending bill that will phase out and repeal federal tax policies creating jobs, driving new investments in manufacturing, and increasing American energy production. Businesses have ann...


Releases

Businesses Cancel $1.4 Billion In New Factories, Energy Projects in May as Congress Pushes Forward on Tax Increases

Cancellations now total $15.5 billion since January; nearly 12,000 jobs lost GOP districts see $9 billion in investments; 10,000 jobs disappear due to cancelled or delayed projects so far $444 million in new investments announced in M...


Releases

Senate Bill Threatens Investments, Jobs, Energy Security

Federal tax policies that are creating jobs and increasing America’s energy supplies would be phased out or repealed in new language released by the Senate Finance Committee today as part of President Trump’s massive tax and spending package.


Donate Today