
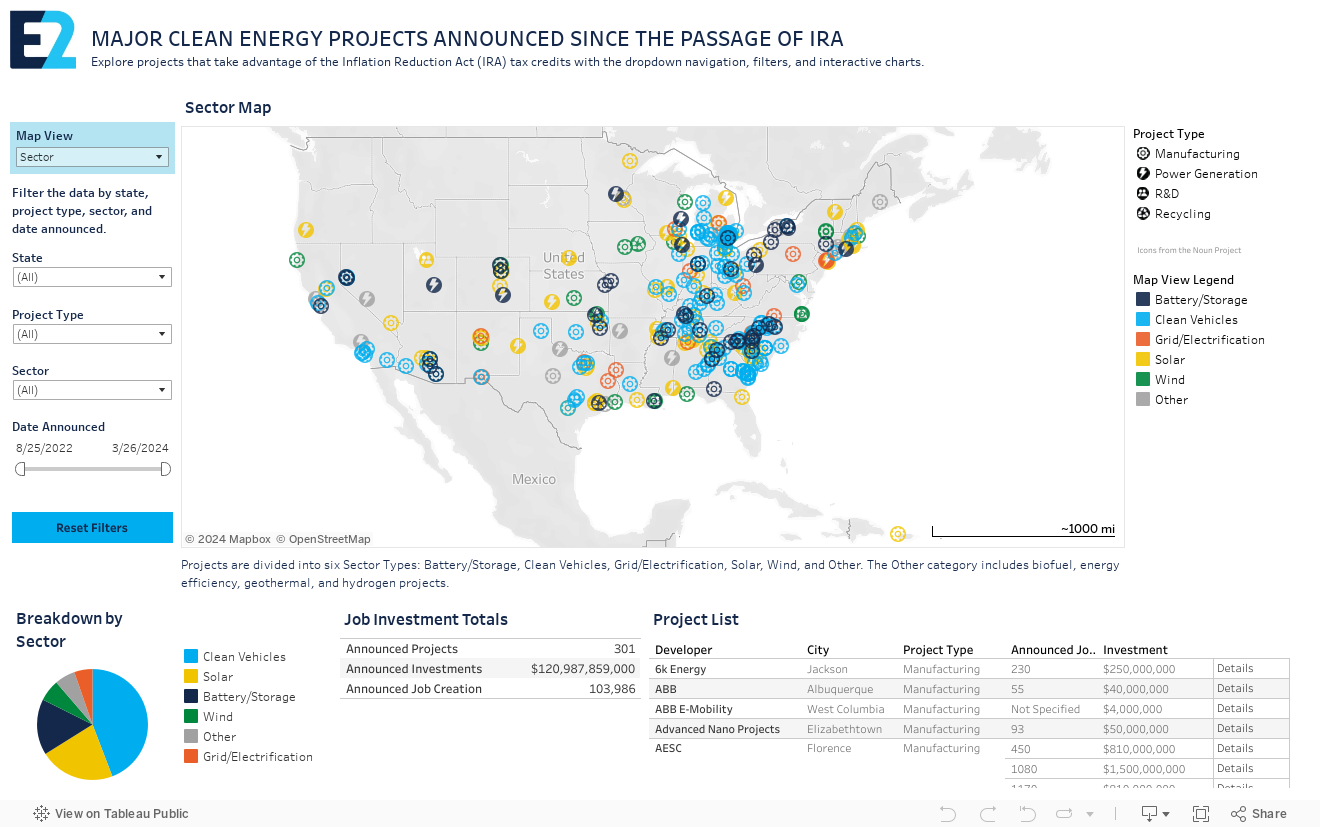
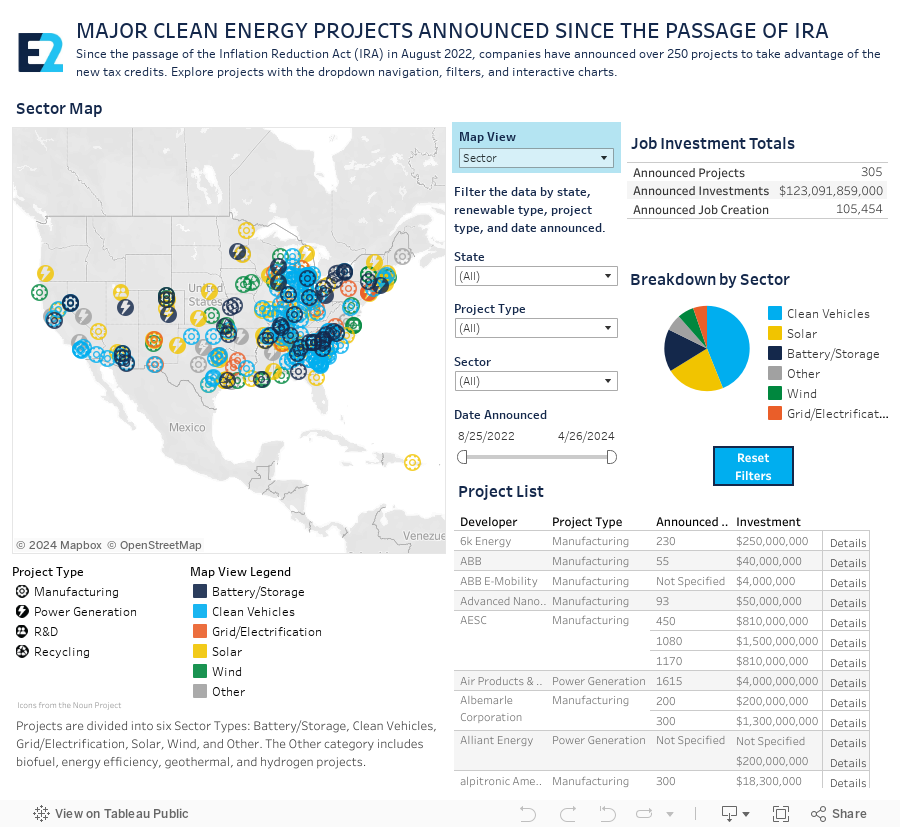
APPENDICES | cumulative totals 2022-2026
by year, industry, sector, technology, state, party affiliation
Projects Announced | by year
| Year | Projects | MW | Investment | Jobs |
|---|---|---|---|---|
| 2022 | 307 | 41,275 | $108,782,425,223 | 171,198 |
| 2023 | 338 | 27,727 | $121,046,122,169 | 174,435 |
| 2024 | 388 | 76,991 | $136,781,293,010 | 338,760 |
| 2025 | 156 | 10,888 | $30,258,652,712 | 72,164 |
| 2026 YTD | 171 | 22,110 | $55,188,545,785 | 121,571 |
| Grand Total | 1,360 | 178,989 | $452,057,038,899 | 878,128 |
Projects Announced | by industry
| Industry | Projects | MW | Investment | Jobs |
|---|---|---|---|---|
| Generation | 884 | 178,989 | $289,997,624,866 | 710,661 |
| Manufacturing | 476 | 0 | $162,059,414,033 | 167,467 |
Projects Announced | by sector
| Sector | Projects | MW | Investment | Jobs |
|---|---|---|---|---|
| Energy Efficiency | 3 | 0 | $160,627,756 | 322 |
| EV | 177 | 0 | $89,948,993,333 | 62,795 |
| Grid | 88 | 0 | $8,890,667,000 | 24,818 |
| Hybrid (Gen/BESS) | 147 | 59,826 | $97,479,404,170 | 278,779 |
| Renewable | 646 | 86,306 | $173,331,724,316 | 288,976 |
| Storage | 299 | 32,857 | $82,245,622,324 | 222,438 |
Projects Announced | by technology
| Technology | Projects | MW | Investment | Jobs |
|---|---|---|---|---|
| Batteries | 341 | 32,857 | $111,610,515,657 | 237,424 |
| Distribution Equipment | 35 | 0 | $3,002,425,000 | 11,378 |
| EV Parts & Assembly | 132 | 0 | $56,560,100,000 | 45,549 |
| Heat Pumps | 3 | 0 | $160,627,756 | 322 |
| Hydroelectric | 2 | 40 | $68,904,326 | 48 |
| Hydrogen | 13 | 0 | $939,200,000 | 748 |
| Management Equipment | 14 | 0 | $1,720,000,000 | 5,203 |
| Solar | 550 | 69,871 | $138,225,963,805 | 278,687 |
| Solar + Batteries | 147 | 57,486 | $93,957,621,222 | 268,661 |
| Storage | 1 | 0 | $3,500,000,000 | 1,600 |
| Transformers | 38 | 0 | $4,093,242,000 | 8,967 |
| Wind | 32 | 465 | $4,130,541,760 | 3,714 |
| Wind + Batteries | 52 | 18,271 | $34,087,897,373 | 15,827 |
Projects Announced | by congressional district party affiliation
| Party | Projects | MW | Investment | Jobs |
|---|---|---|---|---|
| Democratic | 327 | 32,921 | $83,375,291,807 | 175,746 |
| Republican | 921 | 126,999 | $336,422,805,027 | 620,573 |
| Unknown | 86 | 13,918 | $24,052,283,657 | 60,734 |
| Vacant Seat | 26 | 5,151 | $8,206,658,408 | 21,075 |
Projects Announced | by state
| State | Projects | MW | Investment | Jobs |
|---|---|---|---|---|
| Alabama | 24 | 1,698 | $6,199,164,675 | 9,851 |
| Alaska | 1 | 0 | $1,125,000,000 | 256 |
| Arizona | 48 | 12,440 | $26,230,554,932 | 60,963 |
| Arkansas | 12 | 2,484 | $3,907,663,855 | 10,443 |
| California | 104 | 17,015 | $29,218,794,981 | 82,430 |
| Colorado | 22 | 3,521 | $5,446,935,126 | 15,485 |
| Connecticut | 7 | 630 | $1,078,611,995 | 3,245 |
| Florida | 22 | 906 | $1,704,866,204 | 4,169 |
| Georgia | 62 | 4,744 | $20,869,904,518 | 37,419 |
| Hawaii | 5 | 296 | $458,930,421 | 1,371 |
| Idaho | 7 | 1,238 | $1,997,367,161 | 4,956 |
| Illinois | 36 | 3,984 | $9,003,421,055 | 13,537 |
| Indiana | 38 | 3,983 | $17,442,983,030 | 20,800 |
| Iowa | 11 | 1,088 | $1,604,816,918 | 3,054 |
| Kansas | 7 | 297 | $625,550,798 | 1,636 |
| Kentucky | 35 | 2,696 | $10,330,479,443 | 16,333 |
| Louisiana | 19 | 1,849 | $4,887,370,106 | 8,039 |
| Maine | 4 | 493 | $747,888,653 | 2,320 |
| Maryland | 8 | 366 | $904,586,084 | 1,536 |
| Massachusetts | 7 | 418 | $749,858,488 | 3,591 |
| Michigan | 50 | 2,340 | $15,009,874,055 | 17,448 |
| Minnesota | 8 | 165 | $479,582,190 | 1,573 |
| Mississippi | 23 | 2,047 | $6,167,958,178 | 10,709 |
| Missouri | 15 | 2,170 | $3,705,643,078 | 8,224 |
| Montana | 3 | 1,384 | $2,419,595,777 | 2,157 |
| Nebraska | 2 | 100 | $188,546,483 | 531 |
| Nevada | 17 | 3,844 | $14,919,318,400 | 30,732 |
| New Hampshire | 1 | 0 | $0 | 0 |
| New Jersey | 2 | 20 | $36,381,002 | 122 |
| New Mexico | 29 | 7,031 | $18,993,743,613 | 21,538 |
| New York | 34 | 3,115 | $9,751,384,144 | 9,471 |
| North Carolina | 55 | 1,495 | $23,139,907,617 | 18,628 |
| North Dakota | 9 | 1,562 | $2,537,544,303 | 2,728 |
| Ohio | 41 | 2,504 | $12,988,751,529 | 13,409 |
| Oklahoma | 23 | 3,297 | $7,592,142,078 | 11,231 |
| Oregon | 11 | 7,500 | $11,787,625,374 | 32,889 |
| Pennsylvania | 35 | 2,617 | $5,183,833,995 | 11,615 |
| Puerto Rico | 1 | 0 | $0 | 800 |
| South Carolina | 53 | 1,847 | $19,111,946,859 | 23,728 |
| South Dakota | 2 | 299 | $524,145,731 | 384 |
| Tennessee | 40 | 773 | $10,292,744,911 | 9,206 |
| Texas | 307 | 56,417 | $108,354,044,632 | 267,608 |
| Utah | 16 | 2,913 | $5,264,660,283 | 13,814 |
| Vermont | 2 | 70 | $102,108,945 | 232 |
| Virginia | 57 | 3,788 | $9,821,082,193 | 18,497 |
| Washington | 11 | 4,825 | $7,489,092,347 | 21,927 |
| West Virginia | 8 | 277 | $1,818,229,384 | 2,305 |
| Wisconsin | 22 | 3,518 | $5,353,775,675 | 13,653 |
| Wyoming | 4 | 2,926 | $4,488,627,680 | 11,535 |
Projects Cancelled/Closed/Downsized | by year
| Year | Projects | MW | Investment | Jobs |
|---|---|---|---|---|
| 2022 | 33 | 2,223 | $4,091,716,719 | 7,895 |
| 2023 | 42 | 4,537 | $10,183,700,789 | 22,456 |
| 2024 | 72 | 11,512 | $33,779,618,556 | 43,337 |
| 2025 | 145 | 13,468 | $58,238,172,545 | 87,107 |
| 2026 | 93 | 14,696 | $29,494,275,232 | 80,018 |
| Grand Total | 385 | 46,436 | $135,787,483,841 | 240,813 |
Projects Cancelled/Closed/Downsized | by industry
| Industry | Projects | MW | Investment | Jobs |
|---|---|---|---|---|
| Generation | 270 | 46,436 | $94,746,383,841 | 172,905 |
| Manufacturing | 115 | 0 | $41,041,100,000 | 67,908 |
Projects Cancelled/Closed/Downsized | by sector
| Sector | Projects | MW | Investment | Jobs |
|---|---|---|---|---|
| EV | 68 | 0 | $26,137,600,000 | 47,674 |
| Grid | 1 | 0 | $150,000,000 | 600 |
| Hybrid (Gen/BESS) | 35 | 13,044 | $22,716,058,351 | 58,251 |
| Renewable | 190 | 24,144 | $59,544,851,858 | 66,676 |
| Storage | 91 | 9,248 | $27,238,973,632 | 67,612 |
Projects Cancelled/Closed/Downsized | by technology
| Technology | Projects | MW | Investment | Jobs |
|---|---|---|---|---|
| Batteries | 116 | 9,248 | $42,167,173,632 | 84,804 |
| EV Parts & Assembly | 1 | 0 | $70,000,000 | 700 |
| Hydrogen | 40 | 0 | $10,929,400,000 | 28,764 |
| Solar | 5 | 0 | $997,900,000 | 1,300 |
| Solar | 156 | 16,651 | $30,127,028,617 | 63,323 |
| Solar + Batteries | 35 | 12,559 | $21,875,018,056 | 57,440 |
| Transformers | 1 | 0 | $150,000,000 | 600 |
| Wind | 30 | 7,428 | $28,530,987,909 | 2,855 |
| Wind + Batteries | 1 | 550 | $939,975,627 | 1,027 |
Projects Cancelled/Closed/Downsized | by congressional district party affiliation
| Party | Projects | MW | Total Investment | Investment |
|---|---|---|---|---|
| Democratic | 97 | 8,672 | $28,128,489,875 | 59,941 |
| Republican | 261 | 32,299 | $82,014,783,300 | 170,059 |
| Unknown | 17 | 4,259 | $23,533,285,590 | 4,883 |
| Vacant Seat | 10 | 1,206 | $2,110,925,076 | 5,930 |
Projects Cancelled/Closed/Downsized | by state
| State | Projects | MW | Investment | Jobs |
|---|---|---|---|---|
| Alabama | 3 | 165 | $269,430,427 | 592 |
| Arizona | 7 | 600 | $2,258,261,940 | 8,220 |
| Arkansas | 1 | 0 | $0 | 545 |
| California | 21 | 1,144 | $2,299,781,780 | 5,558 |
| Colorado | 9 | 1,899 | $4,025,735,893 | 9,766 |
| Florida | 4 | 111 | $202,780,633 | 457 |
| Georgia | 13 | 1,423 | $5,647,240,961 | 7,408 |
| Hawaii | 4 | 220 | $411,107,077 | 1,037 |
| Idaho | 1 | 400 | $680,902,984 | 1,881 |
| Illinois | 9 | 1,495 | $5,731,220,789 | 5,905 |
| Indiana | 9 | 1,035 | $4,405,215,374 | 6,848 |
| Iowa | 1 | 212 | $353,572,600 | 60 |
| Kansas | 2 | 600 | $1,375,755,578 | 3,722 |
| Kentucky | 7 | 50 | $1,349,504,101 | 3,608 |
| Louisiana | 2 | 215 | $327,247,636 | 712 |
| Maine | 3 | 105 | $165,997,763 | 349 |
| Maryland | 3 | 1,012 | $6,104,372,903 | 526 |
| Massachusetts | 1 | 0 | $200,000,000 | 100 |
| Michigan | 20 | 20 | $8,985,276,953 | 11,017 |
| Minnesota | 3 | 80 | $153,975,515 | 458 |
| Mississippi | 2 | 0 | $836,000,000 | 2,800 |
| Missouri | 5 | 130 | $773,486,520 | 580 |
| Montana | 5 | 730 | $1,251,467,434 | 3,010 |
| Nebraska | 3 | 521 | $882,218,547 | 147 |
| Nevada | 11 | 4,649 | $9,275,868,893 | 18,560 |
| New Hampshire | 2 | 130 | $219,864,228 | 430 |
| New Jersey | 2 | 2,363 | $15,043,735,180 | 912 |
| New Mexico | 4 | 555 | $2,857,635,655 | 5,235 |
| New York | 33 | 2,148 | $5,242,502,605 | 11,164 |
| North Carolina | 15 | 461 | $2,202,835,529 | 9,147 |
| North Dakota | 2 | 550 | $932,702,778 | 154 |
| Ohio | 16 | 1,745 | $5,894,868,261 | 11,968 |
| Oklahoma | 8 | 693 | $2,106,484,989 | 3,269 |
| Oregon | 9 | 71 | $119,854,478 | 1,146 |
| Pennsylvania | 13 | 864 | $1,399,748,175 | 2,671 |
| Rhode Island | 1 | 10 | $15,759,439 | 33 |
| South Carolina | 18 | 620 | $3,357,547,402 | 5,425 |
| Tennessee | 6 | 0 | $3,552,500,000 | 6,360 |
| Texas | 81 | 16,487 | $28,998,783,969 | 77,311 |
| Utah | 2 | 75 | $136,428,757 | 457 |
| Virginia | 15 | 1,795 | $3,689,535,021 | 8,203 |
| Washington | 5 | 360 | $645,210,890 | 1,832 |
| West Virginia | 1 | 0 | $150,000,000 | 600 |
| Wisconsin | 1 | 75 | $165,835,999 | 458 |
| Wyoming | 2 | 619 | $1,089,228,185 | 172 |
About This Analysis
The Clean Economy Works (CEW) analysis is an ongoing monthly tracking of large-scale clean energy project announcements, cancellations, closures, and downsizes across the United States. This analysis monitors private-sector investment in clean energy manufacturing, generation, and storage projects since federal energy tax credits were passed in August 2022. The tracking excludes manufacturing projects that began, were proposed, sited, or in any way began development prior to the federal energy tax incentives of 2022, as well as those funded entirely by federal sources or lacking specific geographic data. Separately, generation projects are tracked throughout all of 2022 and projects tracked prior to 2026 are dated by year-only rather than quarter, month, or day (explained further below). CEW measures key indicators including investment value, job creation or losses, project types (manufacturing, generation, storage), and distribution by sector, state, and party affiliation of congressional district.
Manufacturing projects are tracked through publicly available company announcements, public filings, media reporting, statements by local leaders and other public sources. This analysis is limited to only private-sector investment in clean energy manufacturing and generation projects since federal energy tax credits were passed in August 2022. The tracking excludes projects that were proposed, sited, or in any way began development prior to the passage of federal energy tax credits as well as those funded entirely by federal sources or lacking specific geographic data. Project delays or idling of facilities are not included unless there is an announced decrease in production or investment or unless the project will need to be restarted to proceed in the future.
Job estimates and capital investment figures associated with tracked projects come directly from company announcements or other publicly available data. Consequently, about one-third of all projects include either no job or investment estimates in their announcements. Project details—including locations, job estimates, and investments estimates—are updated when new publicly available information is provided by companies or media reports.
Generation projects are tracked using data analyzed by Atlas Public Policy from the U.S. Energy Information Administration’s (EIA) Preliminary Monthly Electric Generator Inventory (Form EIA-860M), alongside annual EIA generator data where applicable, as the primary source for monitoring new generation project announcements, construction activity, operational changes, cancellations, postponements, and retirements. Under the EIA dataset structure, historical status transitions and project additions are only identifiable by year rather than by exact month or day as is the case with manufacturing projects. As a result 1) historical generation project announcements, construction starts, cancellations, and abandonments can only be dated to the year in which the status change appeared in EIA reporting, and 2) moving forward, E2 will maintain monthly snapshots of the EIA inventory data, allowing future updates to identify generation project changes by month, quarter, and year.
Investment, construction jobs, and operational jobs listed in the tracking are estimates based on size and technology. For solar, biomass, wind, hydroelectric, and geothermal generators, jobs are estimated using multipliers derived from the National Renewable Energy Laboratory Jobs and Economic Development Impacts (JEDI) models. For battery projects, construction jobs are estimated using a multiplier from a separate National Renewable Energy Laboratory study (operations jobs are not estimated due to lack of adequate data). Construction jobs represent the total full-time equivalent workers (FTEs) required over the entire construction period, which varies by generator type, and operations jobs represent FTEs per year that the project is operating.Capital expenditure is estimated by multiplying the nameplate capacity of each project by CAPEX multipliers from the National Renewable Energy Laboratory 2024 Annual Technology Baseline, considering the technology type and operating year. Values are converted to 2024 dollars using Consumer Price Index Data from the Bureau of Labor Statistics. See the full methodology here.
Because EIA generator inventory data is released as periodic monthly snapshots and may include reporting delays from developers, generation project updates lag manufacturing tracking by one month.
Sign-Up for Email Updates
"*" indicates required fields