Clean Economy Works April 2023 | 14 New Projects Announced
FOCUS: Drove my EV to the levee but the levee was dry
When the president of South Korea smoothly belts out the first verse of the Don McLean classic “American Pie” at a White House state dinner, you can be sure the two countries are collaborating on much more than just the occasional live music performance.
That certainly seems to be the case within the booming EV industry, at least judging from the latest batch of clean economy announcements tracked by E2.

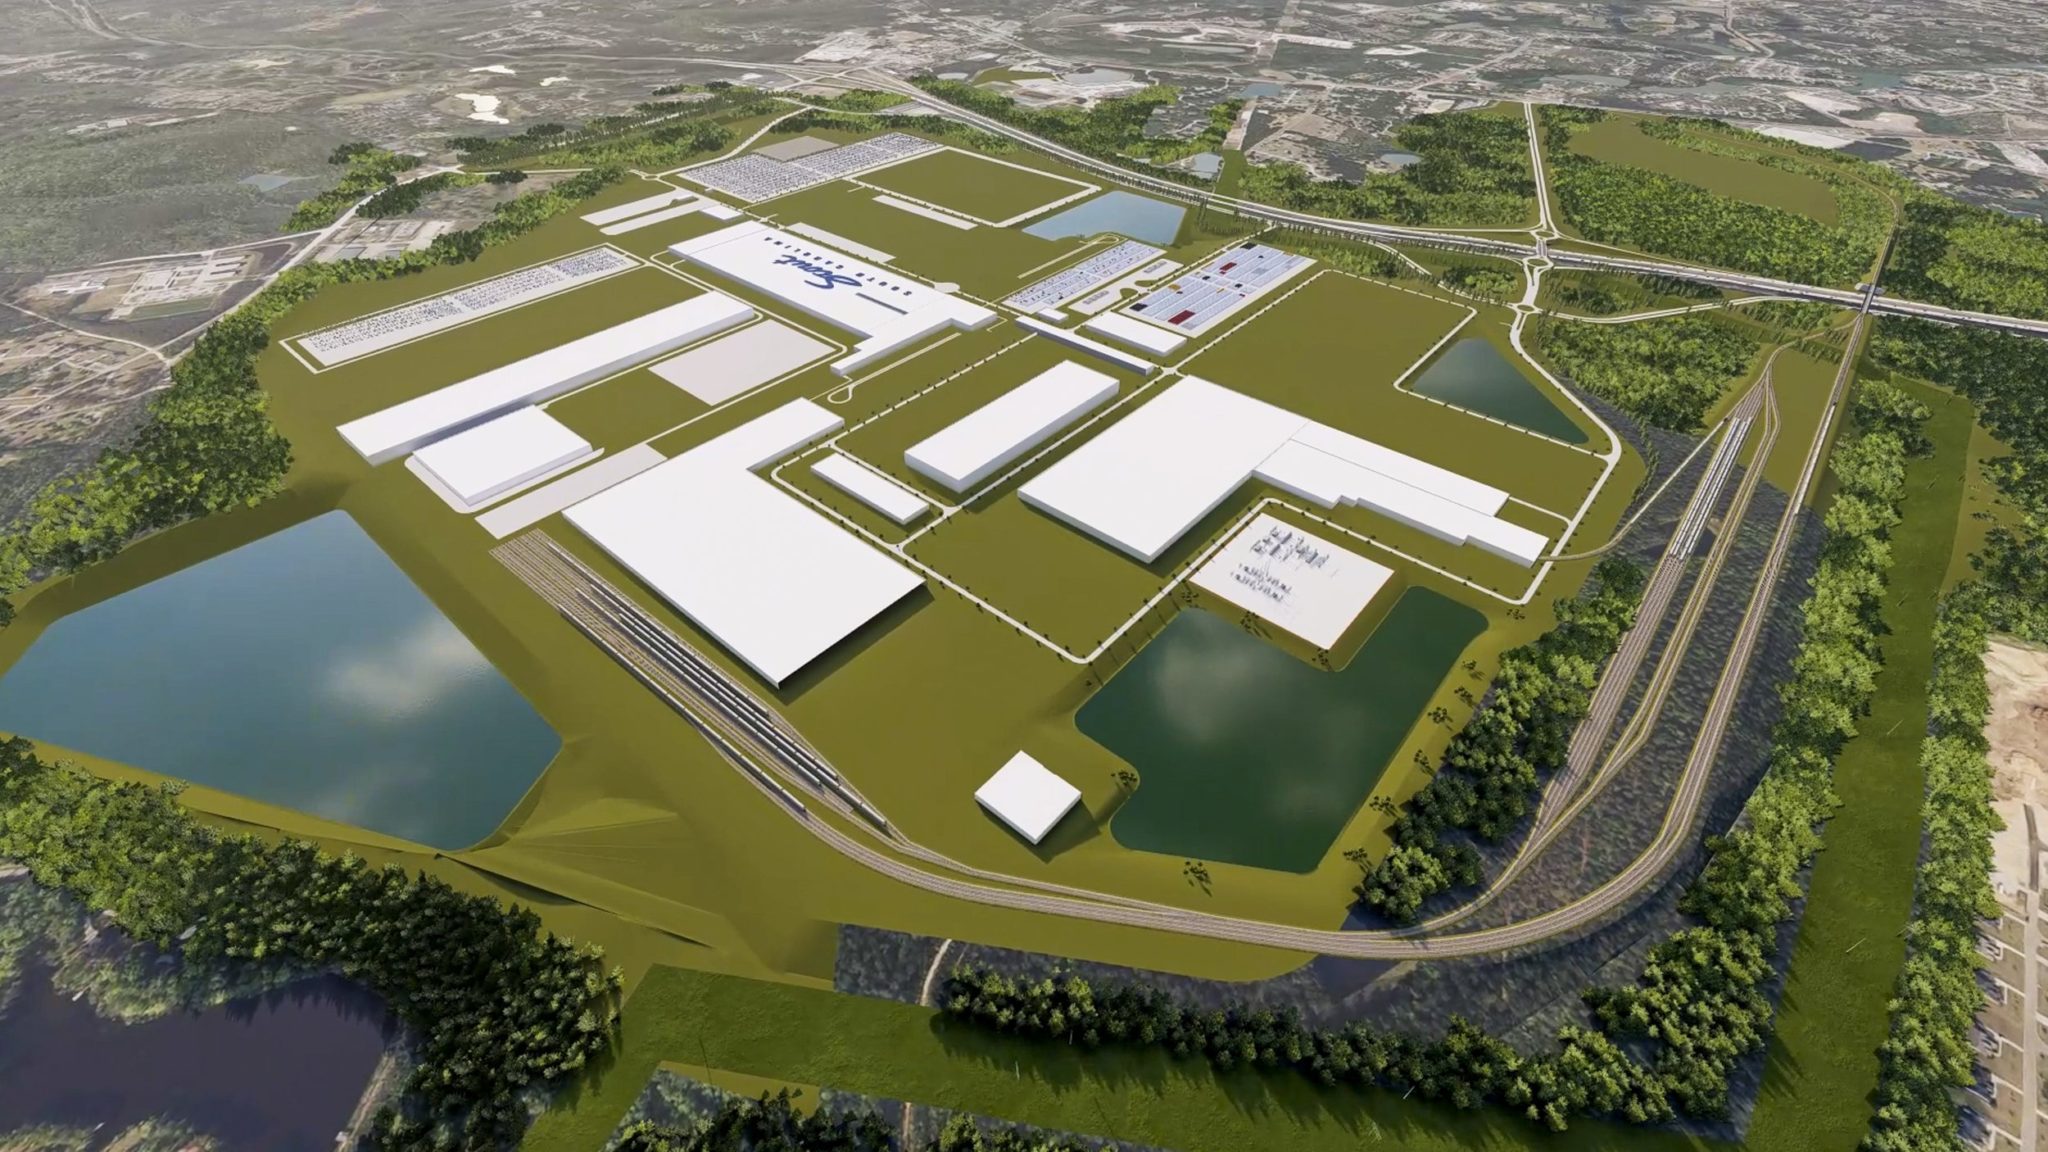
A rendering of Seohan’s Georgia facility announced in April. It will manufacture auto parts for a larger, multi-billion-dollar Hyundai plant nearby. (Photo courtesy of Seohan)
Last month, there were 14 project announcements across 12 states that are expected to drive $2.23 billion in private-sector investments and create at least 1,821 jobs. One of those announcements came from Georgia, where Gov. Brian Kemp (R) announced that Seohan Auto Georgia, a Hyundai parts supplier, will invest $72 million in a new facility in Liberty County. The project is expected to create 180 jobs helping to manufacture shafts, axels and brake systems.
This is at least the 11th major clean economy project announcement made by a South Korean company since the Inflation Reduction Act was signed into law last summer. Ahead of the state dinner/rock performance last week, a fact sheet released by the U.S. Embassy in the Republic of Korea highlighted a few of them, including Hyundai’s new multi-billion-dollar plant in Bryan, Georgia (8,100 jobs, according to the White House), as well as Hanwah Q Cell’s $2.5 billion expansion of its solar factories in Dalton, Georgia.
Both these projects were previously tracked by E2. The new Seohan facility will supply Hyundai’s Bryan plant.
There are several reasons for the steady pace of outsized investments South Korean companies are making in the clean economy in Georgia and other states. One is the proposed federal rule that stipulates tax credits cannot go to clean vehicles that contain battery components manufactured by “a foreign entity of concern,” which is likely to benefit South Korea at the expense of China, at least for now.
At the same time, states like Georgia have been actively courting South Korean companies that are operating in the clean economy, whether it’s Seohan, Hyundai, SK, LG or others. Georgia’s collaboration with South Korea has been so fruitful that in January Gov. Kemp paused his State of the State address to ask Yoonie Kim, his director for Korean investment, to stand and be recognized.
In the months ahead, more opportunities – and challenges – are sure to emerge around foreign investment in the U.S. clean economy. For now, though, the U.S. and South Korea are singing the same tune.
Spotlight

DAVID COHEN-TANUGI
Cleantech venture builder
MIT Proto Ventures
E2 member
Boston, MA
David Cohen-Tanugi is a physicist, entrepreneur, French-American dual national, China expert and former NRDC fellow. At the end of April, he started a new position as the head of cleantech commercialization at MIT’s new venture studio, Proto Ventures. E2 recently caught up with Cohen-Tanugi to talk about his career, venture building and the Inflation Reduction Act.*
How would you describe where you fit into the wider professional landscape?
My specialty is developing and commercializing clean energy technologies. Almost by definition, that requires being a strong technologist and scientist on one hand, but also a savvy, real-world professional with business and leadership experience. I try to bridge those two worlds for maximum impact.
What motivates you?
Two things: the end goal of a cleaner, more sustainable and more just planet, and the desire to make sure that scientific breakthroughs and innovative technologies are being put to good use to tackle climate and sustainability challenges.
How are you helping to make this happen?
I’ve just started a new role as MIT’s first clean energy venture builder. MIT has identified that while there is a lot of entrepreneurial interest among some researchers and students – with dozens or even hundreds of would-be entrepreneurs and teams and spin-offs – big swaths of the technology and knowledge portfolio at MIT are still not being applied in any impactful way.
My job for two years will be to identify the problems in the clean energy space that are the most pressing and that have technology gaps with no clear solutions today. If we then rethink how we approach the technologies, inventions, patents and capabilities coming out of MIT that are not currently being put to good use, that could have a tremendous impact on our clean energy future. At Proto Ventures, we’re working to commercially deploy breakthrough innovations that leverage MIT research and that will have a strong positive impact on the availability of clean energy. We want to use knowledge and MIT’s exceptional people to solve the world’s great challenges in clean energy.
How closely do you pay attention to the cleantech policy landscape?
Certainly, as I enter this new role at MIT and ask myself which problems are the most pressing, I won’t just be looking at dollars and cents and business problems, I’ll also try to get a sense of where the world is headed, where it needs to be headed and where the current policy landscape takes things in the U.S.: What needs to happen? Is there a big gap between where we will need to be, and what’s possible today?
What about the IRA?
The IRA has a big emphasis on domestic production requirements. I think that’s powerful politically, to make sure this is a piece of legislation that has staying power and has broad bipartisan support, including support from different states and different stakeholder groups. It’s also tremendously important that the IRA has a particular emphasis on growing a workforce that benefits from the clean energy transition and the growth of this new sector of the economy.
At the same time, America is a big part of an interdependent global economy, and different countries have a lot to benefit from each other’s competitive strengths and projects. So we need to find a way to make sure all the countries, continents and companies that are aggressively tackling climate change and deploying energy technology can leverage each other and benefit from each other, as opposed to being primarily in competition with each other, or else we just end up with a lot of wasted opportunity. That’s something where I think there are still a lot of open questions, and it’s fascinating to look at.
The IRA also amplifies clean energy venture building at a leading university like MIT by providing the long-term price signals that are essential for raising venture capital in the clean energy sector. The breakthrough technologies and cleantech ventures that come out of Proto Ventures will doubtless leverage the IRA to reach the scale and impact that we really need to transition to a green, clean jobs economy.
*This interview has been edited and condensed.
Opportunities
National funding opportunity calendar for the Bipartisan Infrastructure Law
This document highlights funding opportunities that communities can apply for today, as well as a calendar of key upcoming funding opportunities for 2023. For more information on the full set of programs in the Bipartisan Infrastructure Law, including upcoming milestones, visit build.gov. Read more.
Request for Information: Scaling the U.S. solar manufacturing workforce
DOE’s Solar Energy Technologies Office released an RFI to better understand the anticipated quantity, quality and accessibility of solar manufacturing roles. The RFI will solicit feedback from unions, industry, academia, research laboratories, government agencies and other stakeholders on the challenges and opportunities associated with a historic expansion of the U.S. solar manufacturing workforce. Read more.
Biden-Harris Administration proposes strongest-ever pollution standards for cars and trucks to accelerate transition to a clean-transportation future
The EPA announced new proposed federal vehicle emissions standards that will accelerate the ongoing transition to a clean vehicles future and tackle the climate crisis. The new proposed emissions standards for light-, medium-, and heavy-duty vehicles for model year 2027 and beyond would significantly reduce climate and other harmful air pollution, unlocking significant benefits for public health, especially in communities that have borne the greatest burden of poor air quality. At the same time, the proposed standards would lower maintenance costs and deliver significant fuel savings for drivers and truck operators. Read more.
EPA releases framework for the implementation of the Greenhouse Gas Reduction Fund
The EPA released new details about the design of the $27 billion Greenhouse Gas Reduction Fund, a first-of-its-kind, national-scale competitive grant program created by the President’s Inflation Reduction Act. This program will leverage public investment with private capital and finance clean energy projects that reduce pollution and energy costs, increase energy security and create good-paying jobs, especially in low-income and disadvantaged communities and places that have historically shouldered the burden of pollution. Read more.
DOE: $450 million to deploy clean energy projects on mine lands
DOE announced up to $450 million from the Bipartisan Infrastructure Law to advance clean energy demonstration projects on current and former mine lands. Approximately 17,750 mining sites occupy 1.5 million acres in the U.S. Repurposing this extensive area of land for clean energy projects could generate up to 90 GW of clean energy – enough to power nearly 30 million American homes – while reducing greenhouse gas emissions that jeopardize public health and pollute local ecosystems. Read more.
Biden-Harris Administration announces availability of $1 billion to help farmers, ranchers and rural businesses invest in renewable energy systems and energy-efficiency improvements
The USDA announced it is accepting applications for $1 billion in grants to help agricultural producers and rural small businesses invest in renewable energy systems and make energy-efficiency improvements. USDA is making the grants available under the Rural Energy for America Program, with funding from the Inflation Reduction Act. Read more.
Energizing Rural Communities Prize
The $15 million Energizing Rural Communities Prize challenges individuals and organizations to develop partnership plans or innovative financing strategies to help rural or remote communities improve their energy systems and advance clean energy demonstration projects. The application period for Phase 1 closes May 24. This prize is part of the $1 billion Energy Improvements in Rural or Remote Areas Program, created by DOE’s Office of Clean Energy Demonstrations. The program supports projects that improve the resilience, reliability, safety, availability and environmental performance of energy systems in rural or remote areas of the U.S. with populations of no more than 10,000 people. Read more.
Biden-Harris Administration announces nearly $585 million from Bipartisan Infrastructure Law to repair aging water infrastructure, advance drought resilience
The White House announced a nearly $585 million investment from the Bipartisan Infrastructure Law for infrastructure repairs on water delivery systems throughout the West. Funding will go to 83 projects in 11 states to improve water conveyance and storage, increase safety, improve hydro power generation and provide water treatment. Among the projects selected for funding are efforts to increase canal capacity, provide water treatment for Tribes, replace equipment for hydropower production and provide necessary maintenance to aging project buildings. Projects will be funded in Arizona, California, Colorado, Idaho, Montana, Nevada, New Mexico, North Dakota, Oregon, South Dakota and Washington. Read more.
Biden-Harris Administration announces historic funding for 37 projects to improve safety, fix old, leaky gas pipes and create jobs
The U.S. Dept. of Transportation and the Pipeline and Hazardous Materials Safety Administration announced $196 million in grants for 37 projects across 19 states. This new grant program helps improve public safety, protect public health and reduce methane emissions from natural gas distribution pipes. The Natural Gas Distribution Infrastructure Safety and Modernization grant program, established by the Bipartisan Infrastructure Law, provides nearly $1 billion in funding over the course of five years to modernize municipally and community-owned natural gas distribution pipes. Read more.
April Clean Economy Announcements
In April, E2 tracked 14 project announcements across 12 states that are expected to drive $2.23 billion in private-sector investments and create at least 1,821 jobs.
| DATE | COMPANY/ORG | STATE | ANNOUNCEMENT | SECTOR | DETAILS |
|---|---|---|---|---|---|
| 4/3 | ABB | NM | Link | Charging/Grid | 55 Jobs $40M |
| 4/4 | BorgWarner | MI | Link | EV | 186 Jobs $20.6M |
| 4/5 | Toyota | AL | Link | Solar Generation | $49M |
| 4/6 | UCore North America | LA | Link | EV/Wind Manufacturing | 100 Jobs $75M |
| 4/11 | Seohan Auto | GA | Link | EV | 180 Jobs $72M |
| 4/18 | 6k Energy | TN | Link | Battery/Storage | 230 Jobs $250M |
| 4/19 | BorgWarner | SC | Link | Battery/Storage | 122 Jobs $42M |
| 4/21 | Jinko Solar | FL | Link | Solar Manufacturing | 250 Jobs $53M |
| 4/25 | Alliant Energy | WI | Link | Solar Generation | |
| 4/26 | Prolec GE USA | LA | Link | Solar Manufacturing/Wind Manufacturing | 153 Jobs $28.5M |
| 4/26 | Bosch | CA | Link | EV | |
| 4/26 | Prysmian Group | PA | Link | Charging/Grid | 27 Jobs $22.5M |
| 4/26 | SEM Wafertech & Solar4America | SC | Link | Solar Manufacturing | 300 Jobs $65.8M |
| 4/27 | Rivian | KY | Link | EV | 218 Jobs $10M |