E&E News discusses the current status and issues facing Oregon’s effort to launch a California-style cap-and-trade system. “Those who are opposed just want to buy more time,” said Erik Wohlgemuth, chief operating officer of sustainability nonprofit Future 500, who is lobbying state lawmakers in Salem today with the group Environmental Entrepreneurs. “This has been studied, […]
With the Oregon State Legislature considering two versions of a bill to establish a statewide Cap-and-Invest program, E2 members from across the state sent this letter to all Oregon legislators urging both chambers to support this bill that will empower Oregon to continue its progress in combating climate change and to assert its position as […]
New Jersey Assemblymember, Andrew Zwicker, writes an op-ed instilling hope in a future in clean energy. Clean energy is already a tremendous job-driver in New Jersey. Three times more New Jerseyans work in solar- and wind-related jobs as do in fossil fuel electric generation. An analysis by ReThink Energy NJ and Environmental Entrepreneurs (E2), a national, […]
This past summer, Xcel Energy and a wide group of stakeholders at the Public Utilities Commission (PUC), filed a “Stipulation” – a proposed update to Xcel’s Electric Resource Plan. It is an agreement between Xcel, its customers, Colorado businesses, local environmental organizations and others on how and where Xcel sources its power. The plan would […]
But what, exactly, does the economic activity happening all across the state look like?
E2 — along with our partners at FracTracker Alliance, and in continuing partnership with New Yorkers for Clean Power and the Alliance for Clean Energy New York — attempted to find out.
We compiled a series of four maps showing the location of clean energy businesses across the state as well as sites where renewable energy is generated.
The purpose of the maps is to help policymakers, press and individuals better understand the scope of New York’s clean energy economy — and how much room it has to grow.
Map user’s guide
When viewing the map, note the “Layers” option on the black bar at the top of the map. Click the drop-down menu to select different layers of information. When a layer is selected, a description of that layer is displayed in the left-hand column.
E2’s Pennsylvania Clean Energy Map shows the location of clean energy businesses across the state as well as sites where renewable energy is generated.
The purpose of the map is to help policymakers, press and individuals better understand the scope of Pennsylvania’s clean energy economy – and how much room it has to grow.
Here’s the map:
Rural areas hubs of clean energy activity
As our map shows, as of June 2016 Pennsylvania had more than 2,500 megawatts (MW) of renewable energy capacity from solar, wind and small hydroelectric plants.
Of that capacity, about half – or 1,300 MW – comes from wind, while nearly 1,000 MW comes from small hydroelectric plants. The remaining 240 MW comes from solar photovoltaic (PV) projects – i.e., the solar panels that you see on rooftops and in fields.
The majority of clean energy businesses are located in the Philadelphia and Pittsburgh metro areas and surrounding counties. However, as the map shows, less-urban counties actually have the most renewable energy generating capacity.
For example, Lancaster County has the largest renewable energy generating capacity in the state, with 720-plus MW. Lancaster Countyis a solar leader. Its 1,000 solar systems and its nearly 50 MW of solar PV power generating capacity are both tops in the state, mainly due to the large number of farms now using solar energy.
Chester County is the state’s No. 2 solar county with more than 800 solar systems and 21 MW of generating capacity.
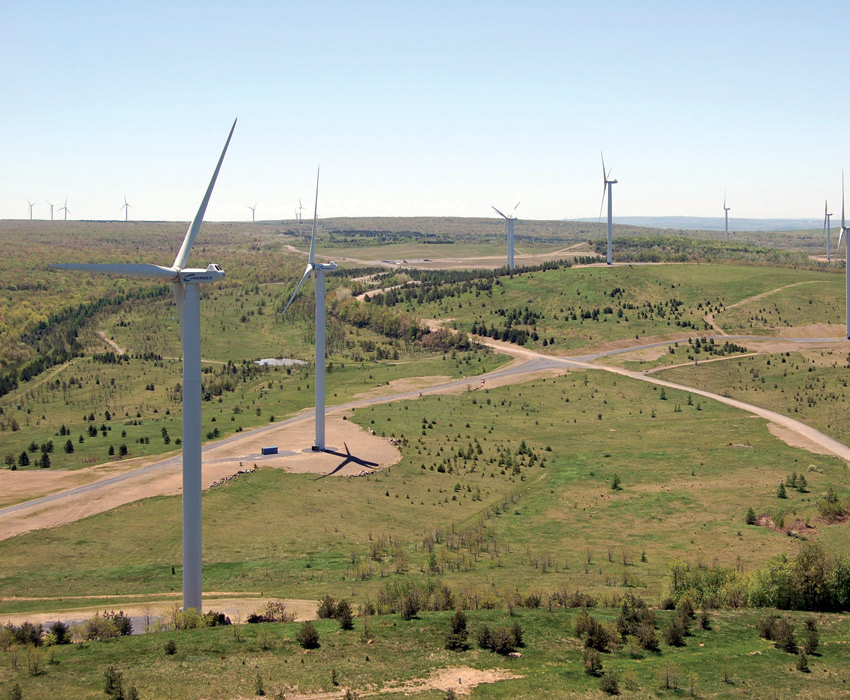
Cambria County’s Highland Wind Farm was developed on an old strip mine. (Photo courtesy of EverPower Wind Holdings)
Further west, Somerset and Cambria counties are Nos. 2-3 when it comes to overall renewable energy generating capacity, with 360-plus MW and about 250 MW, respectively. Both rely on wind for most of their renewable energy capacity.
The 62.5 MW Highland Wind Farm in Cambria County, for example, was brought online in 2009 by EverPower Wind Holdings. Situated on a reclaimed strip mine, nine full-time workers maintain and operate its 25 turbines.
Top 10 counties in PA for renewable energy generation
Ranking
County
Total Renewable Generation (MW)
1
Lancaster
774
2
Somerset
364
3
Cambria
248
4
Blair
157
5
Schuylkill
148
6
Wyoming
143
7
Bucks
130
8
Fayette
103
9
Tioga
101
10
Delaware
84
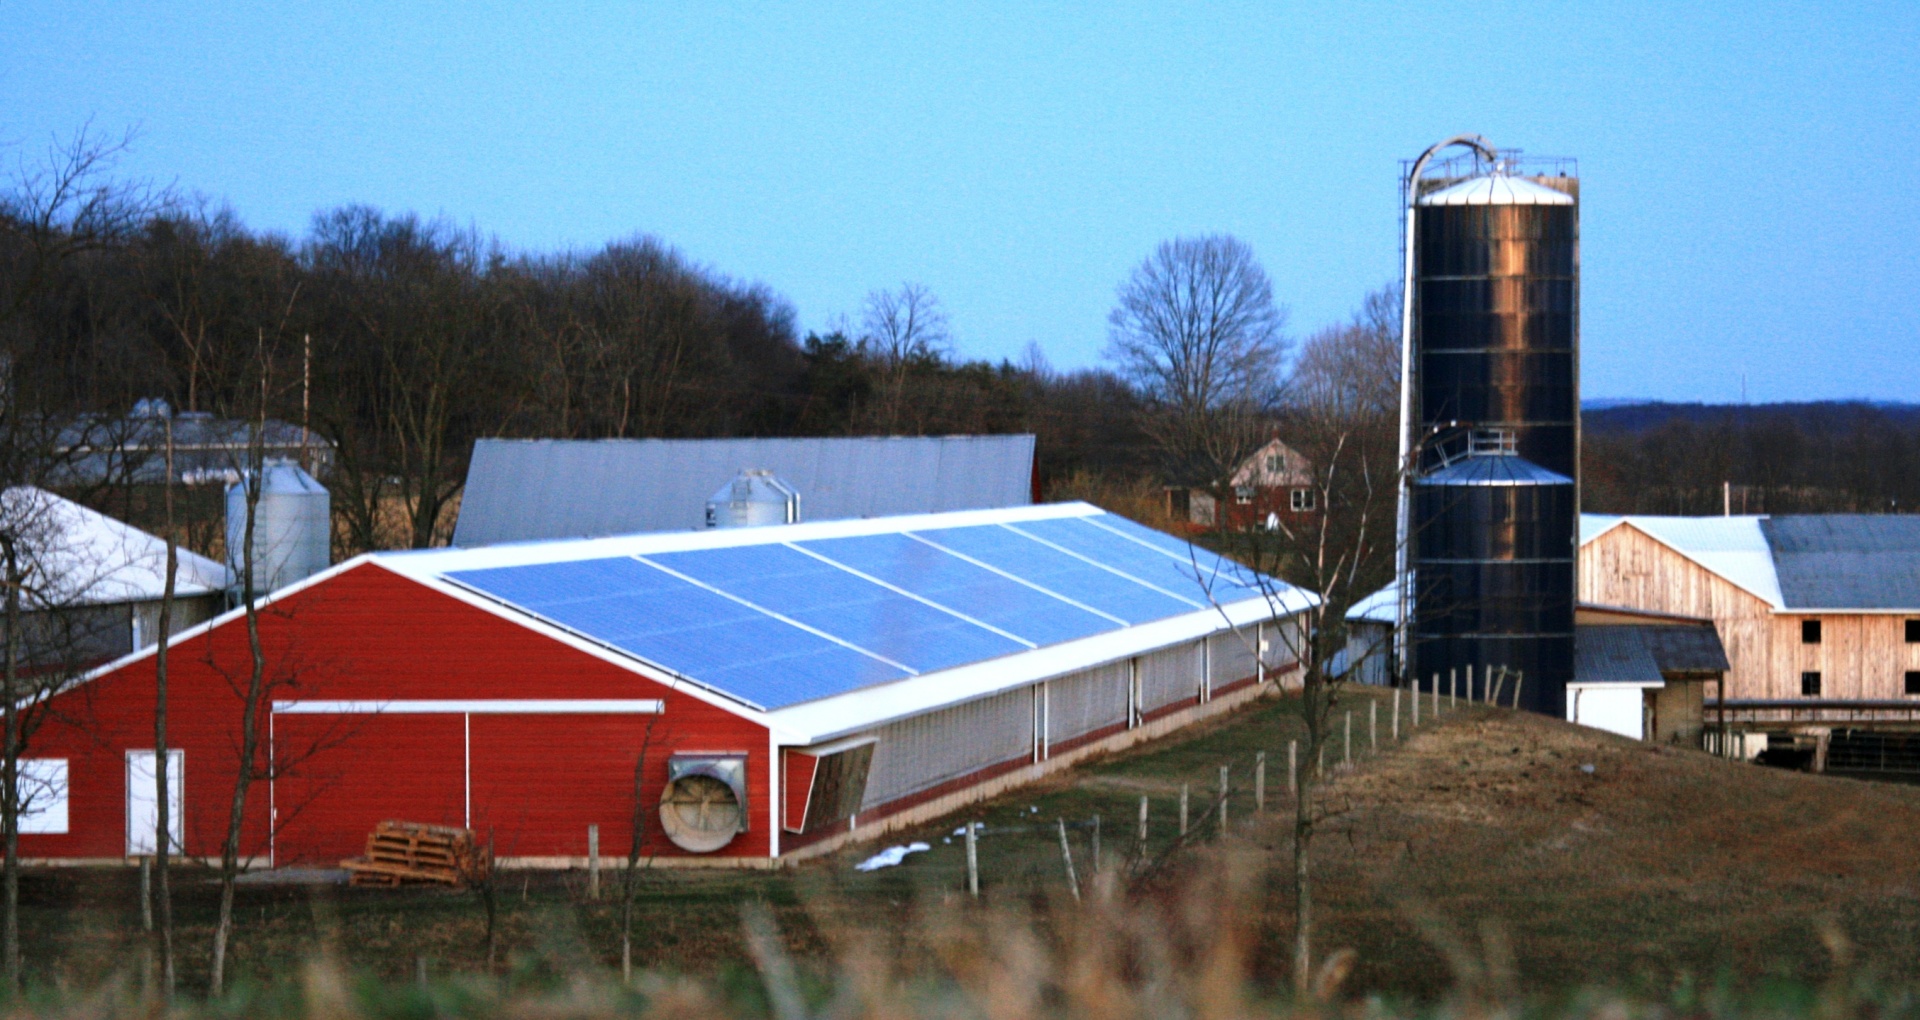
At Focus Farm, a turkey farm in Lewisburg, a rooftop solar array installed by Energy Independent Solutions helped create jobs in a rural part of Central Pennsylvania. (Photo courtesy of EIS Solar)
6,000 clean energy businesses in Pennsylvania
As outlined in E2’s “Clean Jobs PA” report, there are 66,000 clean energy jobs at nearly 6,000 clean energy businesses in Pennsylvania. This was based on data collected from the U.S. Bureau of Labor Statistics and from a BW Research Partners survey of hundreds of Pennsylvania companies.
Map user’s guide
When viewing the map, note the “Layers” option on the black bar at the top of the map. Click the drop-down menu to select different layers of information. When a layer is selected, a description of that layer is displayed in the left-hand column.
The Clean Energy Businesses layer shows locations of businesses involved in the solar, energy efficiency, geothermal, and “other” sectors. See “Registry” for the types of businesses included. When clicking the icon on the map, the user can view information about that particular business.
The Utility-ScaleRenewable Energy Facilities layer shows utility-scale wind, solar and hydroelectric generation facilities larger than 1 MW. This information is derived from the U.S. Energy Information Agency, retrieved July 2016. [Source: http://www.eia.gov/maps/layer_info-m.cfm, Power Plants data set, last updated 7/7/2016]
The Commercial and Residential PV Systems layer shows 7,035 commercial and residential solar PV generation facilities. To protect the privacy of individual home and business owners, the icons are randomly placed within the zip code region of each address. Exact addresses for these locations are not shown, and when the map is enlarged, these icons disappear.
[Note: Data for the Commercial and Residential PV Systems Data layer was retrieved from a Right-to-Know Request from the Pennsylvania Department of Environmental Protection by the Mid-Atlantic Renewable Energy Association (MAREA) of all the solar PV systems that received Pennsylvania Sunshine Grant money through the closure of that program in December 2013. As of June 28, 2016, there were 8,518 solar PV systems in Pennsylvania registered with PJM, so almost 1,500 of these systems do not appear on the map because their locations are not available.]
State and House Districts layers outline Pennsylvania state legislative districts.
More about the map
The Clean Energy Map of PA includes companies from E2’s jobs report survey. The map also includes data from Conservation Service Providers registered with the Pennsylvania Public Utility Commission to provide services under Act 129, as well as data obtained via internet searches of clean energy companies throughout the state.
The map is a dynamic, “living” tool. It will continually capture and update information on companies helping expand Pennsylvania’s clean energy economy. Every month, we add clean energy companies to the map. (However, it is important to note that we do not endorse or vet companies that choose to be included in the map.)
“Oregon: Changing Climate, Economic Impacts, and Policies for our Future” is a first-of-its-kind resource for businesses, entrepreneurs, and policymakers. In addition to examining the economic threat climate change poses to Oregon, the report highlights the economic benefits and job opportunities that can be created by deploying more clean energy.
As Tennessee’s clean energy economy expands, the industry will contribute to statewide economic vitality. With a diverse renewable energy portfolio and robust employment across all value-chain activities, employers are optimistic about future growth. Increased support for local suppliers and vendors will encourage successful industry expansion, spur local job creation, and further bolster the state’s economy.
Tennessee could capitalize on its market diversity by tapping into the region’s renewable potential and committing to energy efficiency as a resource. The National Renewable Energy Laboratory (NREL) found that Tennessee’s technical solar potential for utility-scale projects is 1,296 GW and 16 GW for rooftop photovoltaics. With an additional 54 GW potential from geothermal systems and 1 GW from hydropower, the state’s clean energy cluster will benefit by developing these resources.49 Other states provide solid examples of how effective energy efficiency policies focused on consumer incentives, rebates and proactive utility programs can create jobs across traditional industries, especially within the building trades.50 States that are leaders in energy efficiency have illustrated that supportive clean energy policies are highly correlated to economic impacts, particularly regarding construction-related employment. If Tennessee could emulate these policies, the resulting employment impact could exceed 10,000 new clean energy jobs across the state.
Tennessee is already home to more than 2,600 clean energy employers and nearly 45,000 workers. Its companies supply the market with electric cars, energy efficient materials, renewable energy and advanced building controls. Clean energy employers are adding jobs faster than the overall state economy and project continued growth in the coming year. To sustain this growth, many firms report the need for greater consumer incentives, more supportive policies on renewable energy and more innovative financing mechanisms to expand the state’s clean energy market.
Wind is powering Colorado’s economy. All up and down the supply chain, wind companies in Colorado are taking advantage of the state’s supportive policies and strong resources to manufacture wind turbines, construct wind farms, and operate and maintain the power plants. For its wind energy sector to remain competitive with other state-based wind energy economies, Colorado must continue to lead on clean energy policies. The renewable energy standard has been a huge success, but Colorado’s growing renewable energy sector will need new policy momentum for the years after 2020. Colorado has the opportunity to grow its wind sector even more with strong renewables and efficiency policies to support state implementation of the federal Clean Power Plan. Colorado’s leaders should seize these smart policy opportunities — and reap the benefits of new jobs, investment, and a strengthened economy that come with them
Missouri’s clean energy and transportation industry, encompassing renewable energy, energy efficiency, advanced transportationii, and greenhouse gas emissions management and accounting, accounts for nearly 40,000 workers at more than 4,400 establishments. This number is roughly double Iowa’s clean energy and transportation workforce, but less than half the
workers in Illinois and Massachusetts, suggesting room for growth.
The energy efficiency sector employs 32,576 clean energy workers, which is 83% of all clean energy jobs in Missouri. Renewable energy firms account for 15% of clean energy employment, or 6,050 workers—3,715 of whom are solar employees.
More than 57,000 Pennsylvanians currently work at 4,200 clean energy businesses statewide, according to a first-of-its-kind clean energy jobs report released in 2014 by nonpartisan business groups Keystone Energy Efficiency Alliance (KEEA) and Environmental Entrepreneurs (E2).
More than 130,000 Floridians currently work at 14,000-plus clean energy businesses spread almost equally across the state, according to a first-of-its-kind Florida clean jobs census released today by the nonpartisan business groups Environmental Entrepreneurs (E2), Florida Alliance for Renewable Energy (FARE) and the Florida Chapter of the Energy Services Coalition. “Clean Jobs Florida: Sizing Up Florida’s Clean Energy Jobs Base and its Potential” shows that while clean energy is a significant employer in Florida, the state does not come close to living up to its potential.
Clean energy projects continued to grow in May and June as renewable energy developers and clean energy-related manufacturers raced to meet federal tax credit deadlines amid growing demand and prices for electricity. Still, federal policy rollbacks and othe...
One year after the One Big Beautiful Bill Act (OBBBA) was signed into law—rolling back tax credits and programs related to clean energy manufacturing and renewable electricity—a new economic analysis finds that large-scale clean energy projects abandoned si...
lean energy related companies announced 14 new manufacturing and utility-scale generation and storage projects totaling nearly $3 billion that would create 7,500 new jobs and add nearly 1 gigawatt (GW) in new capacity, according to E2’s latest Clean Economy...
June 18 2026
Donate Today
Make a donation to help E2 advance policies that are good for the economy and good for the environment. Your donation is 100% tax-deductible from our partner, the NRDC.
Please contact E2 Membership Director Ying Li at [email protected] or 212-727-4437 for stock and wire transfer instructions.
For stocks, alert us to the transfer and provide the name of the stock and the number of shares being donated. This will help us track your donation internally and enable NRDC to provide an accurate gift receipt in a timely fashion.
Donations to E2 go directly to NRDC, a 501(c)3, and are fully tax-deductible (Federal Tax ID: 13-2654926). E2 collects no funds. NRDC provides full-time staffing dedicated to E2, as well as administrative, communications, legislative and analyst/policy support for the work of E2.
By Check
Make personal, Foundation or Donor Advised Fund checks payable to NRDC (indicate your donation is for E2 Membership to expedite processing) and send to:
Natural Resources Defense Council
Attn: Gift Processing
40 West 20th Street, 11th floor
New York, NY 10011