Clean Economy Works March 2023 | 28 New Projects Announced
FOCUS: South Carolina earns the (clean economy) top seed
March Madness recently gripped central South Carolina – and it wasn’t just because the top-seeded Gamecocks advanced to the women’s Final Four for the third consecutive season. Last month, a 100-mile swath of the state cutting straight through the University of South Carolina’s hometown featured four major clean economy announcements, more than any other state tracked by E2.
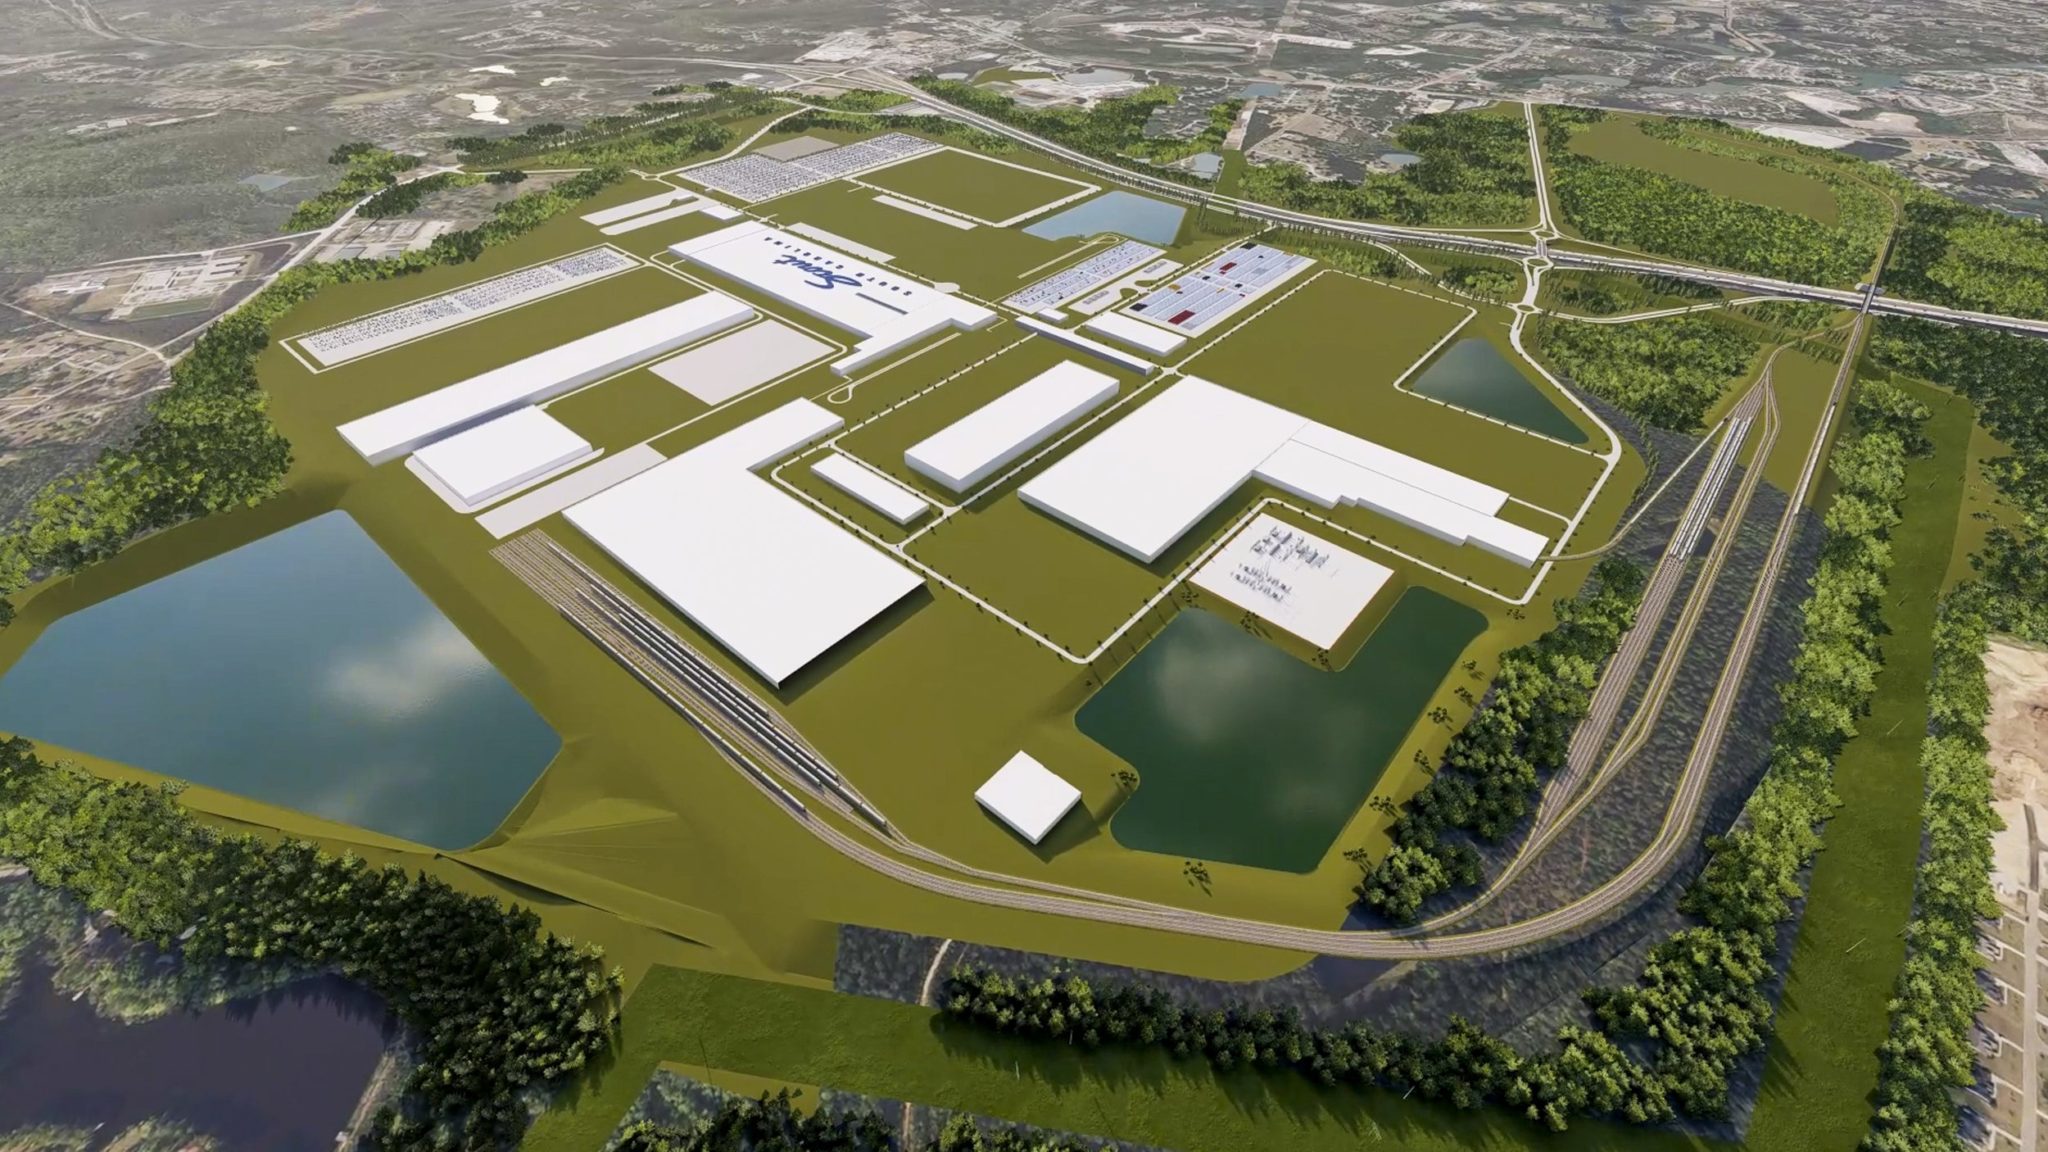
The projects stretched from Chester County, where Albemarle Corp.’s new $1.3 billion flexible lithium processing facility is expected to create 300 jobs paying an average annual salary of $93,000, down through Orangeburg, where a new $33 million solar PV manufacturing plant could create 200 jobs. In between, Volkswagen’s plant in Blythewood will revive the brawny, utilitarian Scout Motors brand as a new EV offering, while Cirba announced a major lithium-ion battery recycling facility in Columbia, just down Shop Road from USC’s Colonial Life Arena, where the Gamecocks haven’t lost since 2020.
Combined, these four projects are expected to bring more than $3.6 billion in investments and nearly 5,000 jobs to the heart of South Carolina – more than half of every clean economy job that was announced nationwide last month.
The EV and battery projects are particularly notable, and not just because of their size. They are the latest evidence the country’s new Battery Belt is firmly entrenched in the South, where companies are focusing investments to maximize on the landmark Inflation Reduction Act. The Battery Belt is helping connect EV automakers, mining companies, semiconductor manufacturers, recycling centers, charging plants and gigafactories all while taking advantage of the region’s trained workers and convenient transportation links.
“We wanted a location with access to nearby rail and port transportation and the availability of skilled workers,” said Albemarle CEO Kent Masters. “We’re excited to have chosen South Carolina and to be closer to our customers as the supply chain is built out in North America.”
In addition to its announcement in South Carolina in March, Albemarle previously announced it is restarting a mine just across the state line in Kings Mountain, N.C., that’s expected to produce enough lithium to power 750,000 electric vehicles annually. Albemarle is also planning a state-of-the-art lithium battery technology research center in nearby Charlotte.
Other battery and EV projects announced in March in the South came from Georgia, Kentucky and Texas. Of course, all these new EVs rolling off assembly lines can be powered by renewable energy, and there were two big projects in that space announced elsewhere in the country last month – a $1.45 billion, 1,200-megawatt wind project in Oklahoma and a $600 million solar project in Ohio.
Spotlight
 CLAUDIA MORSE
Program manager, Form Energy
E2 Emerging Leader
Denver, Colorado
What sparked your interest in clean energy?
I grew up and currently live in Colorado. By the time I was in high school, I had traveled across a lot of the state. I was seeing renewable energy everywhere. There’s the National Renewable Energy Lab in Golden; massive wind farms in the plains near Pueblo; and there’s also a lot of community solar in rural areas. Colorado gets 300 days of sunshine each year. The scale of community solar is so easy for young people to grasp, and it certainly captured my imagination. From there I went to college in upstate New York, where I basically designed my major in inorganic chemistry for renewable energy applications. The interest in renewables among my peers and among students is amazing; now, my college has basically formalized a curriculum for what was once my own bespoke major.
You entered the clean energy workforce only recently, in 2019. What have been some initial impressions of the sector?
I’ve already seen amazing growth. I started out as an intern at an EV battery company called Solid Power. It was a great experience: less than 50 people worked there when I started, and about 250 were there when I left in January. It was chaotic and fun. I onboarded my boss and our whole team. I’ve also worked with lots of people who have transitioned from oil and gas. The vocabulary is different, but a lot of the skills required are similar and a lot of the former oil and gas workers I know are now really passionate about clean energy.
What are you working on now?
I’m a program manager for a utility-scale energy storage/iron-air battery company called Form Energy. We are currently pursuing DOE grants from the Bipartisan Infrastructure Law that will help us decarbonize steel. The BIL is a big focus for us right now because we’re working on utility-scale technologies and we’re pre-commercialization. The IRA has more consumer-facing provisions, but it’s definitely helping raise the whole profile of our industry and it will likely be a big factor for us as time goes on. We recently announced a big contract with Xcel. We’re working with them on iron-air batteries in states with strong renewables policies, like Colorado and Minnesota. We’re also redeveloping an old steel mill in West Virginia. It’s a $760 million iron-air battery project that’s expected to create 750 new full-time jobs.
Opportunities
DOE announces $750 million to advance clean hydrogen technologies
EERE’s Hydrogen and Fuel Cell Technologies Office announced availability of $750 million for research, development, and demonstration efforts to dramatically reduce the cost of clean hydrogen. This is the first tranche of implementation of two provisions contained in the Bipartisan Infrastructure Law. Read more.
DOE announces $156 million to drive industrial decarbonization
EERE’s Industrial Efficiency and Decarbonization Office announced a $156 million funding opportunity to advance high-impact projects that will reduce greenhouse gas emissions across the U.S. industrial sector. This opportunity includes: decarbonizing industrial heat, low-carbon fuels, cross-sector R&D, decarbonizing chemicals, decarbonizing iron and steel and decarbonizing forest products. Concept papers due April 17. Read more.
DOE announces $14 million to optimize production of affordable biofuels and biochemicals
DOE announced $14 million in funding to optimize the production of affordable biofuels and biochemicals while reducing carbon emissions. This opportunity will accelerate the growth of the bioeconomy by supporting the development of high-impact technologies that convert domestic biomass and waste resources into affordable biofuels and bioproducts. Concept papers due April 21. Read more.
DOE launches prize to harness the power of ocean waves with new technologies
EERE’s Water Power Technologies Office launched the Innovating Distributed Embedded Energy Prize, which will award up to $2.3 million over three phases to competitors investigating novel technologies for harnessing and converting the power of ocean waves into usable types of energy. First phase submissions due August 25. Read more.
DOE launches prize to strengthen microelectronic supply chains through microbattery design and commercialization
EERE’s Advanced Materials and Manufacturing Technologies Office launched the Microbattery Design Prize. This two-stage competition will award up to $1.1 million in federal funding, as well as performance and safety testing services with the U.S. National Laboratories, to innovative, small-capacity battery design projects that improve performance, safety and recyclability. Phase 1 applications due by July 1. Read more.
Biden-Harris Administration announces availability of $16 million for pollution prevention in environmental justice communities
The EPA announced the availability of $16 million for two new grant opportunities to support states and Tribes in providing technical assistance to businesses seeking to develop and adopt pollution prevention practices that advance environmental justice in underserved communities. EPA has published two Request for Applications investments made possible by the Bipartisan Infrastructure Law. Read more.
DOE launches second round of Clean Energy Innovator Fellowship Program
DOE launched the second round of the Clean Energy Innovator Fellowship, a workforce development program matching recent graduates and new energy professionals with key energy organizations to help advance clean energy solutions. Applications for host institutions due April 27. Applications should include project scope and describe the institution’s needs. Applications for Innovator Fellows open May 22 and are due June 8. The fellowship is open to recent graduates and mid-career professionals in fields relevant to electricity generation, transmission and distribution. Read more.
March Clean Economy Announcements
In March, E2 tracked 28 projects across 18 states that will bring $13.1 billion in investments and create at least 9,550 jobs.
| DATE | COMPANY/ORG | STATE | ANNOUNCEMENT | SECTOR | DETAILS |
|---|---|---|---|---|---|
| 3/2 | Green Giant Energy | TX | Link | Battery/Storage | $6M |
| 3/3 | Scout Motors | SC | Link | EV | 4000 jobs $2B 200K EV/Y |
| 3/3 | Equinor Wind | NY | Link | Charging/Grid | $215M |
| 3/6 | Amprius Technologies | CO | Link | Battery/Storage | 332 Jobs $190M 500 MWh |
| 3/7 | PHA | GA | Link | EV | 402 Jobs $67M |
| 3/7 | Apex Clean Energy | OK | Link | Wind Gen. | $1.45B 1200 MW |
| 3/8 | Shyft Group | MI | Link | EV | $16M 3000 EV/Yr |
| 3/8 | EvolOH | MA | Link | Fuel-Cells/Hydrogen | 3.75 GW/Y |
| 3/9 | Bullrock Renewables | VT | Link | Solar Gen. | 12 Jobs 3.3 MW |
| 3/9 | Illuminate USA & Invenergy | OH | Link | Solar Mfg. | 1000 Jobs $600M 5 GW/Y |
| 3/10 | Siemens | KS | Link | Wind Mfg. | |
| 3/12 | Gulf Wind Technology & Shell | LA | Link | Wind Gen. | 30 Jobs $10M |
| 3/13 | Hounen Solar | SC | Link | Solar Mfg. | 200 Jobs $33M 1 GW |
| 3/14 | Arcosa | NM | Link | Wind Mfg. | 250 Jobs $55M |
| 3/16 | Foxconn | OH | Link | EV Battery/Storage Mfg. |
|
| 3/16 | Foxconn | WI | Link | EV Battery/Storage Mfg. |
|
| 3/16 | HydrogenPro | TX | Link | Fuel-Cells/Hydrogen | 500 MW |
| 3/20 | Entek | IN | Link | EV Battery/Storage Mfg. |
642 Jobs $1.5B |
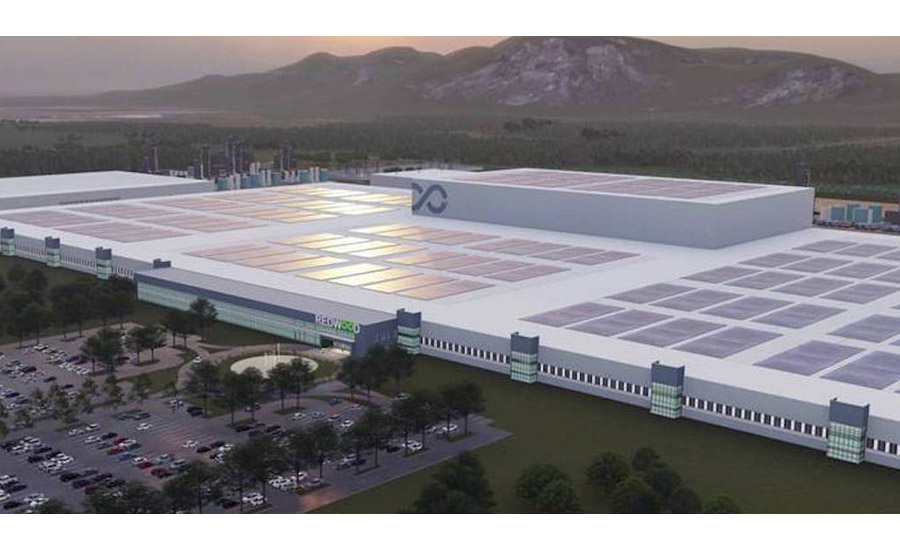
| 3/22 | Cirba Solutions | SC | Link | EV Battery/Storage Mfg. |
300 Jobs $300M |
| 3/22 | Albemarle Corporation | SC | Link | EV Battery/Storage Mfg. |
300 Jobs $1.3B 50K MT/Y |
| 3/22 | Hanwha Advanced Materials Georgia, Inc | GA | Link | Solar Mfg. | 160 Jobs $147 Million |
| 3/23 | Flender Corporation | IL | Link | Wind Mfg. | 50 Jobs |
| 3/23 | LG Energy Solution | AZ | Link | EV | $1.80 |
| 3/23 | LG Energy Solution | AZ | Link | EV Battery/Storage Mfg. |
$2.3B |
| 3/24 | EnerVenue | KY | Link | Battery/Storage Mfg. | 450 Jobs $264M |
| 3/28 | EVelution Energy | AZ | Link | EV Battery/Storage Mfg. Solar Gen. |
360 Jobs $200M |
| 3/30 | Microvast | KY | Link | EV Battery/Storage Mfg. |
563 Jobs $500M |
| 3/30 | Magna | MI | Link | EV | 500 Jobs $100M |
About Clean Economy Works Analysis
This analysis uses only publicly available information from announced funding and plans for clean energy projects, expansions, and renewed production. Projects that began development, were proposed, or applied for local and state approval before the passage of the Inflation Reduction Act in August of 2022 are not included.