SURVEY: Businesses on Impact of Arrested IRA Investments

Date: October 15, 2024

The U.S. is currently home 3.46 million Americans who work across the clean vehicle, renewable energy, energy efficiency, battery storage, grid modernization, and biofuel sectors, according to the latest annual employment analysis from BW Research and E2. And in just the first two years of the IRA, businesses announced $130 billion to fund nearly 340 major clean energy and clean vehicle projects that are expected to hire at least 110,000 new, mostly permanent, workers, according to analysis by E2.

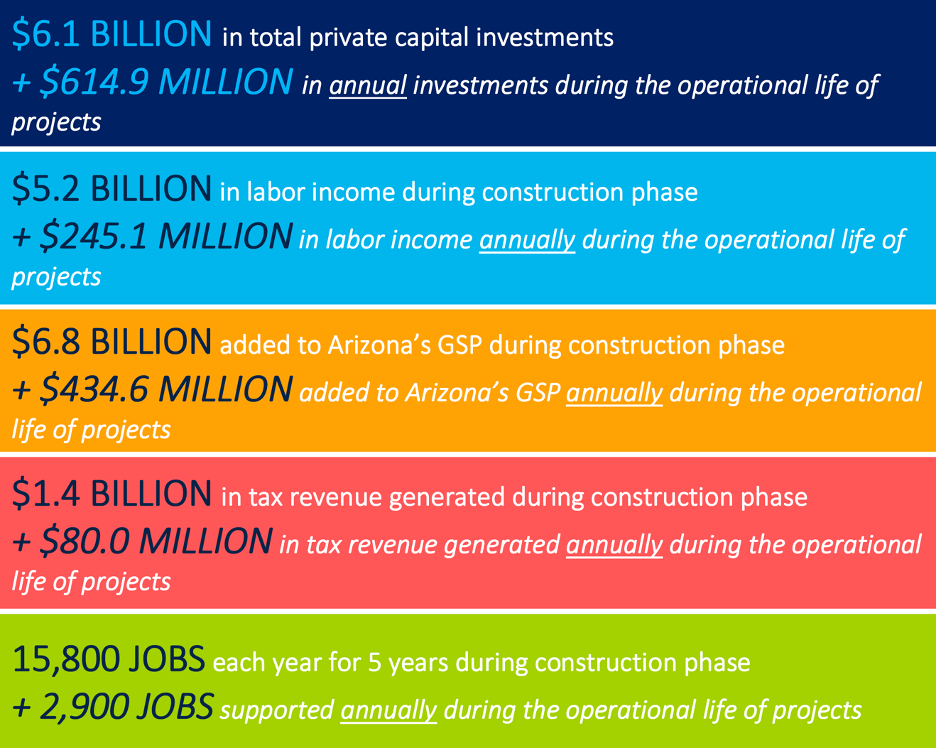
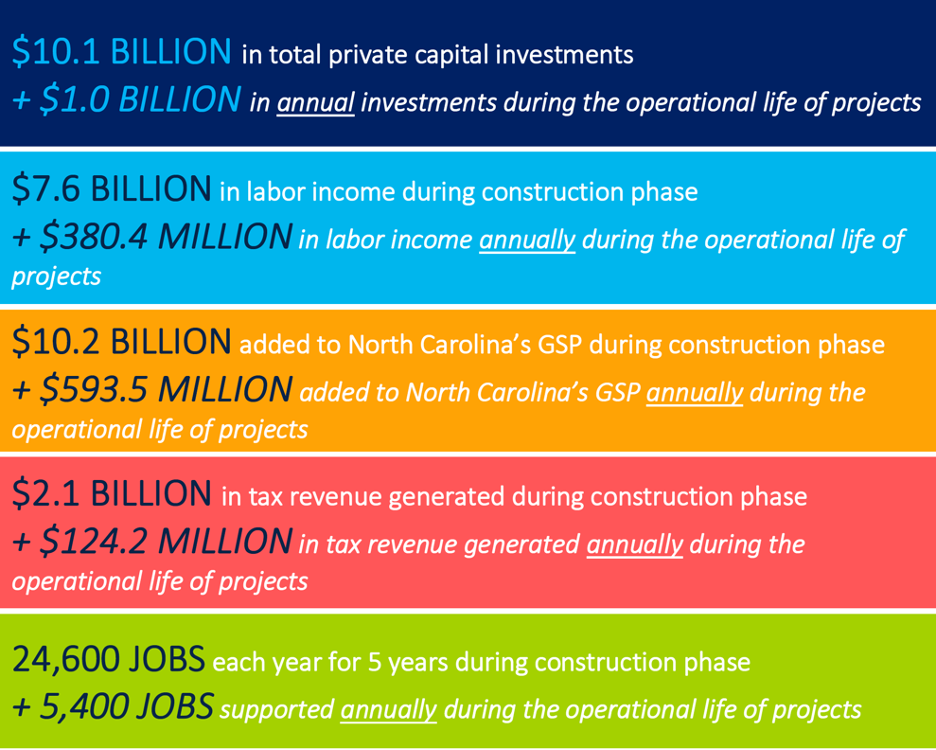
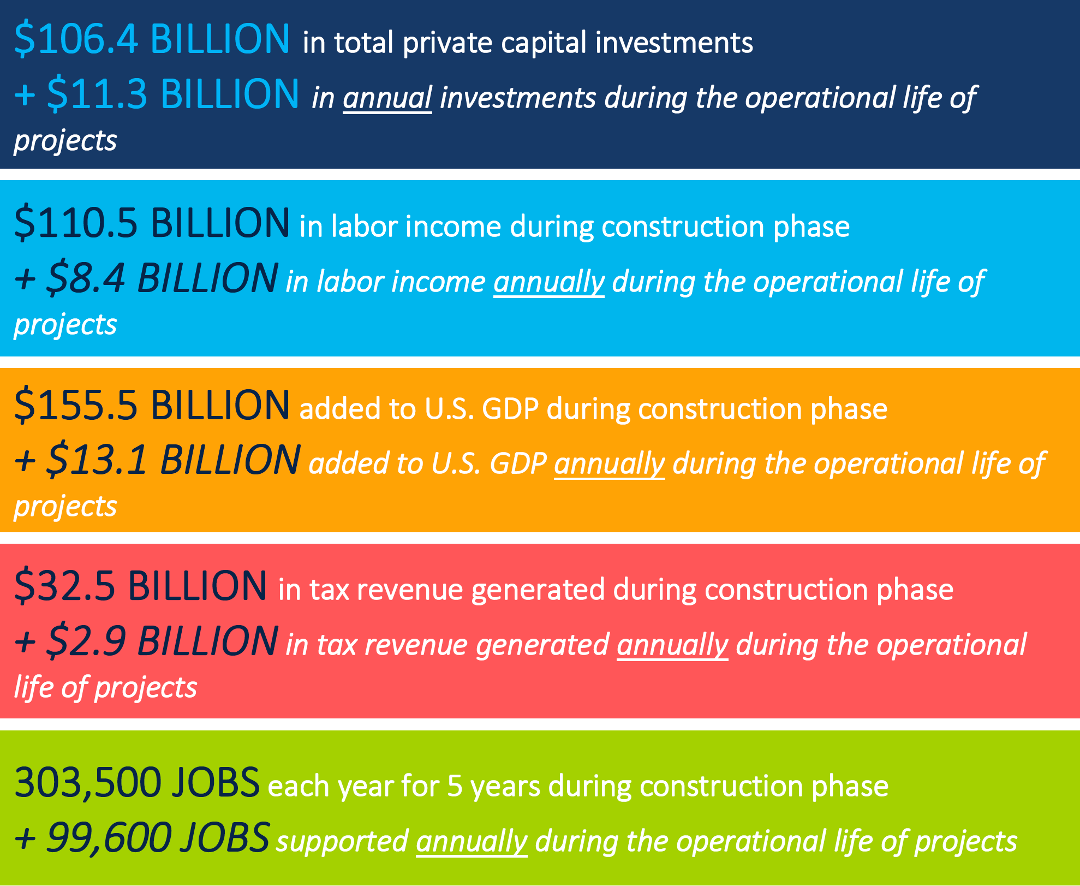
The economic benefits from these projects reach well beyond the direct investments and jobs, however. According to separate modeling by BW Research, the projects announced in the first two years of the IRA will create 621,000 direct and indirect new jobs – including 154,000 permanent jobs – over the next five years. Just during the construction phase alone, these new projects would directly and indirectly add $237.5 billion to U.S. GDP; create $169.4 billion in new wages for workers, and generate nearly $50 billion in new tax revenue for federal, state, and local governments.

To gauge business sentiment on how repealing or rolling back the IRA would impact business investment, hiring, and expansion plans, BW Research focused its outreach on firms working with the following technologies: energy efficiency of buildings, renewable electricity generation, energy storage, grid, renewable fuels, and electric or alternative transportation. The survey captured impacts not just on new businesses or projects since the laws were signed but on long-established companies, with more than 60 percent of the surveyed firms saying they have been in business in the clean energy space for more than ten years.

The executive interviews conducted in parallel with the survey helped reveal other common themes that business owners and decision-makers have seen since the passage of the IRA, as well as key issues for them as they contemplate their businesses’ future. The stakeholder engagement process involved energy businesses in different technologies and regions of the country.

Lastly, the repeal or rollback of the IRA would have impacts that extend far beyond hiring, investment, and expansion plans. In addition to the benefits to businesses created by the IRA, the policy has sent a clear market signal for companies to invest, innovate, and expand in America.

If the policy is repealed, some executives surveyed said they would have to relocate their companies to another country. Others said they would go out of business entirely. Rural areas and small communities across America would be hurt the worst, since rural areas have seen the biggest uptick in clean energy projects, investments and jobs since the IRA.

This field is for validation purposes and should be left unchanged.

Key Findings

  • Repealing the IRA would hurt business or revenue.
    • More than half (53 percent) of firms said they would lose business or revenue as a direct result of an IRA repeal.
    • About 27 percent said they would lose projects or contracts.
    • About 21 percent of impacted firms said they would likely exit the clean energy space.
    • About 11 percent of firms said they would close their business entirely,
    • Nearly 9 percent of firms said they would have to relocate to another country.
  • Businesses would have to lay off employees and cut wages.46 million Americans currently work in clean energy sectors and nearly 150,000 new jobs are being added every year.
    • About 21 percent of firms said they would have to lay off workers if the IRA is repealed.
    • Nearly 15 percent of firms said they would have to lay off 10 or more workers;
    • More than 10 percent of firms said they would have to lay off 25 or more workers.
    • About 13 percent said they’d have to freeze wages or rescind offers to prospective employees.
  • The IRA is very important to business growth.
    • About 85 percent of respondents said the IRA was “very important” or “somewhat important” to growth.
    • Nearly 60 percent of respondents said have worked on, produced goods, or offered services related to clean energy projects directly impacted or funded by the IRA.
    • About 48 percent said that at least half of their business came from IRA-related projects.

Other Key Findings
(based on survey results and stakeholder interviews)

  • The IRA has had a major impact on reducing risk and uncertainty in clean energy markets. A repeal would lead to drastic scaling back of projects and affect investor confidence in the industry.
  • Rural areas and small communities would experience the largest negative effects of a repeal of the IRA. Rural regions have seen the biggest uptake in projects and economic benefits since the passing of the IRA.
  • A repeal of the IRA would disrupt the rapid increase in solar and battery installations as a result of higher installation and materials costs, lower supply as smaller companies leave the market, and lower demand from customers.
  • The IRA has led to the creation of good-quality jobs offering transition pathways for workers in fossil fuels and other industries, particularly in rural areas. The high rate of new project installations, also largely prevalent in rural areas, has brought about a high demand for skilled energy workers.

Methodology

The national survey of nearly 930 business stakeholders was conducted in August 2024, concurrent with the second anniversary of the IRA. It was complemented by interviews with key executives involved in clean energy development, construction, and manufacturing. The survey sought to capture business sentiment about the direct impacts of the IRA, Bipartisan Infrastructure Law (BIL), the CHIPS and Science Act of 2022, as well as state energy policies, on clean energy businesses’ hiring practices, revenue, and decision-making. A larger focus was placed on the impacts of the IRA as opposed to other federal policies due to the IRA’s broad impact on the clean energy and clean vehicles industries.

For full toplines and questions from the employer survey, see Appendix A in the full report.

About E2

E2 is a national, nonpartisan group of business leaders, investors, and professionals from every sector of the economy who advocate for smart policies that are good for the economy and good for the environment. E2 members have founded or funded more than 2,500 companies, created more than 600,000 jobs, and manage more than $100 billion in venture and private equity capital.

For additional insight into E2’s other reports, visit e2.org/reports.

View Report »

Clean Economy Works | An Economic Impact Analysis of Major Clean Energy Projects Announced Through Two Years of the Inflation Reduction Act

Date: October 15, 2024

Summary:

In the first two years under the IRA, businesses announced $130 billion in investments in 338 major clean energy and clean vehicle projects that are expected to create at least 110,000 jobs, according to E2. These projects include factories that produce electric vehicles, batteries, solar panels, wind turbine parts and other goods that benefit from tax credits and other policies created by the IRA.

But the economic benefits from these projects reach well beyond the direct investments and jobs. This analysis is designed to measure the broader indirect and induced economic benefits and the multiplier effect from the investments in these IRA-fueled clean economy projects.

According to this modeling, if completed the projects announced in the first two years of the IRA will create 621,000 direct and indirect new jobs – including 154,000 permanent jobs— throughout the economy over the next five years. This would add $237.5 billion to U.S. GDP; create $169.4 billion in new wages for workers and generate nearly $50 billion in new tax revenue for federal, state, and local governments.

This report builds on the research published in 2023 by E2 and BW Research, detailing the overall economic impacts of the 210 major clean economy projects announced in the first year of the IRA. In the second year of the IRA, an additional 128 clean energy projects were announced.

This analysis uses the original $130 billion in estimated capital expenditures that companies announced in investments for new developments and extrapolates another $32 billion in additional capital expenditures for project announcements that did not include a dollar amount or required an updated estimate based on available information.

Secondary economic benefits extend throughout the economy. When new clean energy projects and clean vehicle factories and thousands of new jobs come to a community, local restaurants sell more meals. Schools, police departments and local public works projects benefit from increases in local tax revenues. Local manufacturers and wholesalers sell more goods to feed the growing local supply chain. And small businesses such as accounting firms, construction contractors, landscaping companies and caterers see new revenue streams.

Together, these direct and indirect jobs and investments tell a nationwide story of opportunity for domestic manufacturing, clean energy production, transportation and infrastructure modernization and American ingenuity, thanks to the clean energy incentives and investments made possible by the IRA.

They are also just the beginning as E2 continues to track new projects being announced every month.

E2 Clean Economy Works project tracking. Available at https://e2.org/announcements/.

This field is for validation purposes and should be left unchanged.

Key Findings

This modeling shows that (if all projects are completed) the 338 major projects tracked by E2 between August 2022 to August 2024 will create or support more than 621,000 jobs, including 467,000 construction jobs each year during construction and another 154,000 jobs each year after that.

While the under construction, these projects will add $237.5 billion to the nation’s GDP, more than the U.S. telecommunications sector adds to GDP annually, and another $20.4 annually once they are up and running—more than the nation’s textile manufacturing industry.

Additionally, these projects will result in $49.8 billion in new tax revenues for federal, state, and local governments while under construction, and an additional $4.4 billion annually after that.

COMBINED ECONOMIC IMPACTS OF MAJOR CLEAN ENERGY PROJECTS ANNOUNCED OVER TWO YEARS OF THE IRA

    • $162 BILLION in total private capital investments
      +$17.5 BILLION in annual investments during operational life of projects
    • $169.4 BILLION in labor income during construction phase
      +$12.9 BILLION in labor income annually during operational life of projects
    • $237.5 BILLION added to U.S. GDP during construction phase
      +$20.4 BILLION added to U.S. GDP annually during operational life of projects
    • $49.8 BILLION in tax revenue generated during construction phase
      +$4.4 BILLION in tax revenue generated annually during operational life of projects
    • 467,000 JOBS each year for 5 years during construction phase
      +154,000 JOBS supported annually during operational life of projects

TOTAL INVESTMENTS INTO AND ANNUAL JOBS SUPPORTED BY CLEAN ENERGY PROJECTS, DETAILED BY ENERGY SECTOR

Sector Total Construction Phase Jobs (Annual jobs for 5 years) Annual Operations Phase Jobs (Annual jobs for lifetime of projects) Sector Announced Capital Investment ($billions) Extrapolated Capital Investment ($billions) Total Capital Investment ($billions) Annual Operational Investment ($billions)
Solar 66,736 21,882 Solar $15.94 $6.93 $22.87 $2.47
Wind 13,447 14,871 Wind $3.97 $1.38 $5.35 $1.66
EV 266,673 78,276 EV $79.22 $9.22 $88.44 $8.84
Electric T&D 6,626 2,502 Electric T&D $1.82 $0.51 $2.33 $0.33
Battery Storage 84,470 22,798 Battery Storage $23.27 $6.87 $30.14 $3.17
Clean Fuels 29,093 13,639 Clean Fuels $6.06 $6.85 $12.90 $1.07
Total 467,045 153,969 Total Capital Investment $130.27 $31.77 $162.04 $17.54

Methodology

This analysis provides a thorough economic prediction of the impacts of the 338 announcements by filling in the gaps of publicly announced information. Modeled impacts differ from initial estimates offered by companies announcing new projects, tracked by E2. Eighty-eight of the 338 announcements provided no capital investment estimate and ninety-four provided no job creation estimate. Additionally, those estimates were inconsistently defined, lacking clarity on if they are direct jobs only or direct, indirect, and induced jobs, and if they were for construction or permanent positions.

To analyze these economic impacts from the clean energy programs and policies in the IRA, BW Research used IMPLAN economic modeling software to estimate the overall economic benefits from publicly sourced clean energy project announcements. BW Research developed a dozen economic impact models in total to represent six tracked sectors: Solar, Wind, Electric Vehicle (EV), Electricity Transmission & Distribution (Electric T&D), Battery Storage, and Clean Fuels. Based on this common methodology and assumptions, BW generated outputs at the national level, including earnings, tax revenue, employment and overall GDP value add.

For more information on methodology, see Appendix C in the report. For the list of all 338 projects announced between August 15, 2022 and August 16, 2024, see Appendix D.

For the latest full list of clean energy job announcements tracked by E2, visit https://e2.org/announcements.

About E2

E2 is a national, nonpartisan group of business leaders, investors, and professionals from every sector of the economy who advocate for smart policies that are good for the economy and good for the environment. E2 members have founded or funded more than 2,500 companies, created more than 600,000 jobs, and manage more than $100 billion in venture and private equity capital.

For additional insight into E2’s other reports, visit e2.org/reports.

View Report »

Clean Economy Works | IRA Two-Year Review

Date: August 14, 2024

Summary:

Two years after the Inflation Reduction Act (IRA) was signed into law on August 16, 2022, companies have announced at least 334 major new clean energy and clean vehicle projects across the country, according to E2’s findings. Of the announcements, 278 included estimates on the number of jobs the projects are expected to create and/or investment amounts. Based on this information, the projects, if completed, would create 109,278 new jobs and bring in $126 billion in private investments.

The 118 announcements in the IRA’s second year are expected to create a combined 34,600 jobs. This extends a wave of IRA-fueled job gains unequaled in the clean energy sector’s history.

The number of major IRA-related clean energy projects announced during the past twelve months declined from the previous year, when 216 projects were announced (211 initially reported). This decline in announcements, while not unexpected, comes amid the uncertainty of the 2024 elections and more than 40 attempts to roll back or reduce parts of the IRA by the U.S. House.

Still, the clean energy projects, jobs and investments related to the IRA are bringing new opportunities and economic benefits to communities across the country. Forty states and two out of three congressional districts are home to at least one announcement. Growth from post-IRA projects tracked by E2 is particularly pronounced in Republican-led districts and states in the South. Nearly 60 percent of the announced projects – representing 85 percent of the investments and 68 percent of the jobs – are in Republican congressional districts. This despite the fact that no Republican voted for the legislation.

Sectors throughout the clean energy industry are expanding. Over the past two years, automakers and their suppliers have announced 132 new or expanded electric vehicle and battery plants and related factories in 23 states, including 39 clean vehicle manufacturing projects in the past year. Solar panel equipment manufacturers are building or expanding 53 factories in 23 states (24 projects in the past year). Renewable energy operators are planning 24 new large-scale wind and solar generation projects across 22 states (10 projects in the past year), while at least 51 new battery/storage projects are in development (19 in the past year, in nearly as many states).

This field is for validation purposes and should be left unchanged.

Highlights

Year Projects States Est. Jobs Est. Investment
Year 1 (Aug’22-Aug’23) 216 38 74,678 $85.125 billion
Year 2 (Aug ’23-Aug ’24) 118 30 34,600 $40.835 billion
Total Since IRA 334 40 109,278 $125.961 billion

* 99 of the 334 announcements did not include investment estimates and 98 did not include job estimates.

  • More than 90 percent of all projects announced since the IRA are in the manufacturing sector.
  • Five states are home to 20 or more projects: Michigan, Georgia, South Carolina, Texas and North Carolina. Six others are home to at least 10: Ohio, Tennessee, California, New York, Indiana and Arizona. Three-dozen states are home to at least two projects.
  • Clean vehicles accounted for more than a third of all projects announced within the past year (45 projects announced).
  • Renewable energy companies announced 31 solar panel and equipment factories and major solar projects in the IRA’s second year, and at least four wind turbine factories or major wind projects.
  • Red states and Republican congressional districts are benefitting the most from the IRA. In its full two-year history, more than half of all projects were in Republican districts, and 19 of the top 20 congressional districts for clean energy investments are held by Republicans. Nearly 40 percent of all 435 U.S. congressional districts are home to at least one announced project.
  • The top congressional districts for clean energy investments are North Carolina’s 9th district with nearly $9.9 billion, represented by Republican Rep. Richard Hudson; Georgia’s 11th congressional district with $6.6 billion, represented by Republican Rep. Barry Loudermilk; and Nevada’s 2nd congressional district with $6.6 billion, represented by Republican Rep. Mark Amodei.
  • The top congressional districts that would see the largest clean energy employment growth from new clean energy projects are North Carolina’s 9th district with 5,660 estimated jobs, represented by Republican Rep. Barry Loudermilk; Nevada’s 2nd congressional district with $5,050 jobs, represented by Republican Rep. Mark Amodei; and South Carolina’s 2nd congressional district, represented by Republican Rep. Joe Wilson.
  • The congressional districts that are home to the most projects announced are: Ohio’s 9th congressional district with eight projects, represented by Democratic Rep. Marcy Kaptur; Georgia’s 1st congressional district with six projects, represented by Republican Rep. Earl Carter; North Carolina’s 9th congressional district with six projects, represented by Republican Rep. Richard Hudson; and South Carolina’s 5th congressional district with six projects, represented by Republican Rep. Ralph Norman.
  • Foreign companies led or were involved with about 160 projects announced since the IRA became law – nearly identical to the number of announced projects from U.S.-based companies.
  • South Korean companies have announced the most projects – about three-dozen in the past two years. Companies based in Michigan and California led announcements from domestic-based companies, with 22 each.

Methodology

The data used in this report is limited to information made publicly available by the companies announcing projects and may not be comprehensive of all major projects that began development after August 16, 2022, nor be exclusive of projects that did not publicly disclose specific plans prior to the passage of the Inflation Reduction Act (IRA). Projects that began development, were proposed, or applied for local and state approval before the passage of the IRA are not included. This analysis also does not include investments in which the federal government has provided financial resources for the complete project, lease sales, projects in which an announcement was made but lacked specific geographic information, etc. Details on projects came from news reports on new and related projects; press releases from companies announcing new developments; and government announcements. 99 of the 334 announcements (30 percent) included no estimated investment data and 98 of the 334 announcements (29 percent) included no job estimates, making this information conservative. Additionally, job estimates announced by companies are overwhelming for permanent jobs and only a handful of announcements since 2022 have included any estimates for temporary or construction jobs that would be created by the projects, meaning the direct employment impact from these projects will be significantly greater than that estimates reviewed in this analysis. Some announcements did not include specific locations that could be used to identify congressional districts.

For the latest full list of clean energy job announcements tracked by E2, visit https://e2.org/announcements.

About E2

E2 is a national, nonpartisan group of business leaders, investors, and professionals from every sector of the economy who advocate for smart policies that are good for the economy and good for the environment. E2 members have founded or funded more than 2,500 companies, created more than 600,000 jobs, and manage more than $100 billion in venture and private equity capital.

For additional insight into E2’s other reports, visit e2.org/reports.

View Report »

Arizona Clean Economy Works: 8 New Clean Energy, Vehicle Projects to Create 18K Jobs, Add $7B to GDP, Generate $5B in Wages for Arizona Workers

Date: July 3, 2024

Summary:

This analysis uses the original $86 billion in estimated capital expenditures that companies announced in investments nationwide for new developments and extrapolates another $20 billion in additional capital expenditures for project announcements that did not include a dollar amount or required an updated estimate based on available information. In addition to the direct benefits of these expenditures, new modeling from BW Research measures the broader economic benefits and the multiplier effect of the investments and jobs expected if the 210 announced projects were completed over the next five years.

When these broader economic benefits are factored in, BW’s modeling expects the 8 large-scale project announced in Arizona tracked by E2 between August 2022 and August 2023 to create or support more than 18,700 jobs and generate billions of dollars in new wages, tax revenue, and economic growth.

These secondary economic benefits are far-reaching. When new clean energy projects and clean vehicle factories and thousands of new jobs come to a community, local restaurants sell more meals. Schools, police departments and local public works projects benefit from increases in local tax revenues. Local manufacturers and wholesalers sell more goods to feed the growing local supply chain. And small businesses such as accounting firms, construction contractors, landscaping companies and caterers see new revenue streams.

Together, these direct and indirect jobs and investments tell a statewide story of opportunity for domestic manufacturing, clean energy production, transportation and infrastructure modernization and American ingenuity, thanks to the clean energy incentives and investments made possible by the IRA.

They are also just the beginning as E2 continues to track new projects being announced every month.

This field is for validation purposes and should be left unchanged.

Key Findings

This report details the economic impacts resulting from the clean energy investments in Arizona that were announced after the passing of the IRA, allowing for a more detailed examination of the economic benefits that the clean energy investments bring to the state. The 8 major Arizona projects tracked by E2 between August 2022-August 2023 will create or support more than 18,700 jobs, including 15,800 jobs each year during construction and another 2,900 jobs each year after.

These private-sector investments and jobs will add $6.8 billion to Arizona’s Gross State Product (GSP) while the projects are under construction, and another $434.6 million annually once they are up and running.

Additionally, these projects will result in $1.4 billion in new tax revenues for federal, state, and local governments while under construction, and an additional $80.0 million annually after.

COMBINED JOBS, WAGE, TAX AND GSP IMPACTS OF MAJOR CLEAN ENERGY PROJECTS ANNOUNCED IN FIRST YEAR OF THE IRA

TOTAL INVESTMENTS INTO AND ANNUAL JOBS SUPPORTED BY CLEAN ENERGY PROJECTS, DETAILED BY ENERGY SECTOR

Sector Total Construction Phase Jobs (Annual jobs for 5 years) Annual Operations Phase Jobs (Annual jobs for lifetime of projects)
Battery / Storage 9,445 1,847
Solar 154 30
EV 6,173 1,052
Total 15,771 2,929


Sector Total Capital Investment ($millions) Extrapolated Capital Investment ($millions) Total Capital Investment ($millions) Annual Operational Investment ($millions)
EV $56 $- $56 $5.60
Battery / Storage $3,500.00 $182.36 $3,682.36 $368.24
Solar $60.00 $- $60.00 $5.94
Total Capital Investment $5,901.00 $248.07 $6,149.07 $614.85

Methodology

This analysis provides a thorough economic prediction of the impacts of the 8 announcements by filling in the gaps of publicly announced information. Modeled impacts differ from initial estimates offered by companies announcing new projects, tracked by E2. One of the eight announcements provided no capital investment estimate and two provided no job creation estimate. Additionally, those estimates were inconsistently defined, lacking clarity on if they are direct jobs only or direct, indirect, and induced jobs, and if they were for construction or permanent positions.

To analyze these economic impacts from the clean energy programs and policies in the IRA, BW Research used IMPLAN economic modeling software to estimate the overall economic benefits from publicly sourced clean energy project announcements. BW Research developed a dozen economic impact models in total to represent six tracked sectors: Solar, Wind, Electric Vehicle (EV), Electricity Transmission & Distribution (Electric T&D), Battery Storage, and Clean Fuels. Based on this common methodology and assumptions, BW generated outputs at the national level, including earnings, tax revenue, employment and overall GSP value add.

For more information on methodology, see Appendix B in the report. For the list of all 10 projects tracked by E2 in the first year of the IRA, see Appendix C.

For the latest full list of clean energy job announcements tracked by E2, visit https://e2.org/announcements.

About E2

E2 is a national, nonpartisan group of business leaders, investors, and professionals from every sector of the economy who advocate for smart policies that are good for the economy and good for the environment. E2 members have founded or funded more than 2,500 companies, created more than 600,000 jobs, and manage more than $100 billion in venture and private equity capital.

For additional insight into E2’s other reports, visit e2.org/reports.

View Report »

New York Clean Economy Works | An Economic Impact Analysis of Major Clean Energy, Vehicle Projects

Date: April 18, 2024

Summary:

This analysis uses the original $86 billion in estimated capital expenditures that companies announced in investments nationwide for new developments and extrapolates another $20 billion in additional capital expenditures for project announcements that did not include a dollar amount or required an updated estimate based on available information. In addition to the direct benefits of these expenditures, new modeling from BW Research measures the broader economic benefits and the multiplier effect of the investments and jobs expected if the 210 announced projects were completed over the next five years.

When these broader economic benefits are factored in, BW’s modeling expects the 10 large-scale project announced in New York tracked by E2 between August 2022 and August 2023 to create or support more than 7,000 jobs and generate tens of billions of dollars in new wages, tax revenue, and economic growth.

These secondary economic benefits are far-reaching. When new clean energy projects and clean vehicle factories and thousands of new jobs come to a community, local restaurants sell more meals. Schools, police departments and local public works projects benefit from increases in local tax revenues. Local manufacturers and wholesalers sell more goods to feed the growing local supply chain. And small businesses such as accounting firms, construction contractors, landscaping companies and caterers see new revenue streams.

Together, these direct and indirect jobs and investments tell a statewide story of opportunity for domestic manufacturing, clean energy production, transportation and infrastructure modernization and American ingenuity, thanks to the clean energy incentives and investments made possible by the IRA.

They are also just the beginning as E2 continues to track new projects being announced every month

This field is for validation purposes and should be left unchanged.

Key Findings

This report details the economic impacts resulting from the clean energy investments in New York that were announced after the passing of the IRA, allowing for a more detailed examination of the economic benefits that the clean energy investments bring to the state. The 10 major New York projects tracked by E2 between August 2022-August 2023 will create or support more than 8,000 jobs, including 6,000 jobs each year during construction and another 1,400 jobs each year after.

These private-sector investments and jobs will add $3.2 billion to New York’s Gross State Product (GSP) while the projects are under construction, and another $224.5 million annually once they are up and running.

Additionally, these projects will result in $736.0 million in new tax revenues for federal, state, and local governments while under construction, and an additional $55.7 million annually after.

COMBINED JOBS, WAGE, TAX AND GSP IMPACTS OF MAJOR CLEAN ENERGY PROJECTS ANNOUNCED IN FIRST YEAR OF THE IRA

TOTAL INVESTMENTS INTO AND ANNUAL JOBS SUPPORTED BY CLEAN ENERGY PROJECTS, DETAILED BY ENERGY SECTOR

Sector Total Construction Phase Jobs (Annual jobs for 5 years) Annual Operations Phase Jobs (Annual jobs for lifetime of projects)
EV 115 25
Electrification, Grid, and Transmission 575 60
Wind 86 90
Solar 8 10
Battery / Storage 4,479 1,037
Clean Fuels 795 165
Total 6,058 1,388


Sector Total Capital Investment ($millions) Extrapolated Capital Investment ($millions) Total Capital Investment ($millions) Annual Operational Investment ($millions)
EV $56 $- $56 $5.60
Electrification, Grid, and Transmission $215 $146.40 $361.40 $33.13
Battery / Storage $75 $2,105.43 $2,180.43 $218.04
Wind $50 $- $50 $17.77
Solar $- $7.52 $7.52 $1.54
Clean Fuels $387 $- $387 $32.01
Total Capital Investment $783 $2,259.35 $3,042.35 $308.09

Methodology

This analysis provides a thorough economic prediction of the impacts of the 10 announcements by filling in the gaps of publicly announced information. Modeled impacts differ from initial estimates offered by companies announcing new projects, tracked by E2. Five of the 10 announcements provided no capital investment estimate and four provided no job creation estimate. Additionally, those estimates were inconsistently defined, lacking clarity on if they are direct jobs only or direct, indirect, and induced jobs, and if they were for construction or permanent positions.

To analyze these economic impacts from the clean energy programs and policies in the IRA, BW Research used IMPLAN economic modeling software to estimate the overall economic benefits from publicly sourced clean energy project announcements. BW Research developed a dozen economic impact models in total to represent six tracked sectors: Solar, Wind, Electric Vehicle (EV), Electricity Transmission & Distribution (Electric T&D), Battery Storage, and Clean Fuels. Based on this common methodology and assumptions, BW generated outputs at the national level, including earnings, tax revenue, employment and overall GSP value add.

For more information on methodology, see Appendix B in the report. For the list of all 18 projects tracked by E2 in the first year of the IRA, see Appendix C.

For the latest full list of clean energy job announcements tracked by E2, visit https://e2.org/announcements.

About E2

E2 is a national, nonpartisan group of business leaders, investors, and professionals from every sector of the economy who advocate for smart policies that are good for the economy and good for the environment. E2 members have founded or funded more than 2,500 companies, created more than 600,000 jobs, and manage more than $100 billion in venture and private equity capital.

For additional insight into E2’s other reports, visit e2.org/reports.

View Report »

Michigan Clean Economy Works | An Economic Impact Analysis of Major Clean Energy, Vehicle Projects

Date: April 17, 2024

Summary:

This analysis uses the original $86 billion in estimated capital expenditures that companies announced in investments nationwide for new developments and extrapolates another $20 billion in additional capital expenditures for project announcements that did not include a dollar amount or required an updated estimate based on available information. In addition to the direct benefits of these expenditures, new modeling from BW Research measures the broader economic benefits and the multiplier effect of the investments and jobs expected if the 210 announced projects were completed over the next five years.

When these broader economic benefits are factored in, BW’s modeling expects the 18 large-scale Michigan project announcements tracked by E2 between August 2022 and August 2023 to create or support nearly 28,000 jobs and generate tens of billions of dollars in new wages, tax revenue, and economic growth.

These secondary economic benefits are far-reaching. When new clean energy projects and clean vehicle factories and thousands of new jobs come to a community, local restaurants sell more meals. Schools, police departments and local public works projects benefit from increases in local tax revenues. Local manufacturers and wholesalers sell more goods to feed the growing local supply chain. And small businesses such as accounting firms, construction contractors, landscaping companies and caterers see new revenue streams.

Together, these direct and indirect jobs and investments tell a statewide story of opportunity for domestic manufacturing, clean energy production, transportation and infrastructure modernization and American ingenuity, thanks to the clean energy incentives and investments made possible by the IRA.

They are also just the beginning as E2 continues to track new projects being announced every month

This field is for validation purposes and should be left unchanged.

Key Findings

This report details the economic impacts resulting from the clean energy investments in Michigan that were announced after the passing of the IRA, allowing for a more detailed examination of the economic benefits that the clean energy investments bring to the state. The 18 major Michigan projects tracked by E2 between August 2022-August 2023 will create or support more than 27,900 jobs, including 21,700 jobs each year during construction and another 6,200 jobs each year after.

These private-sector investments and jobs will add $9.7 billion to Michigan’s Gross State Product (GSP) while the projects are under construction, and another $706.7 million annually once they are up and running.

Additionally, these projects will result in $1.9 billion in new tax revenues for federal, state, and local governments while under construction, and an additional $165.0 million annually after.

COMBINED JOBS, WAGE, TAX AND GSP IMPACTS OF MAJOR CLEAN ENERGY PROJECTS ANNOUNCED IN FIRST YEAR OF THE IRA

TOTAL INVESTMENTS INTO AND ANNUAL JOBS SUPPORTED BY CLEAN ENERGY PROJECTS, DETAILED BY ENERGY SECTOR

Sector Total Construction Phase Jobs (Annual jobs for 5 years) Annual Operations Phase Jobs (Annual jobs for lifetime of projects)
EV 19,752 3,958
Electrification, Grid, and Transmission 890 323
Solar 606 726
Clean Fuels 491 1,192
Total 21,739 6,199


Sector Total Capital Investment ($billions) Extrapolated Capital Investment ($billions) Total Capital Investment ($billions) Annual Operational Investment ($billions)
EV $8.33 $- $8.33 $0.83
Electrification, Grid, and Transmission $0.38 $- $0.38 $0.06
Solar $- $0.42 $0.42 $0.09
Clean Fuels $0.40 $- $0.40 $0.03
Total Capital Investment $9.10 $0.42 $9.52 $1.01

Methodology

This analysis provides a thorough economic prediction of the impacts of the 18 announcements by filling in the gaps of publicly announced information. Modeled impacts differ from initial estimates offered by companies announcing new projects, tracked by E2. Two of the 18 announcements provided no capital investment estimate and five provided no job creation estimate. Additionally, those estimates were inconsistently defined, lacking clarity on if they are direct jobs only or direct, indirect, and induced jobs, and if they were for construction or permanent positions.

To analyze these economic impacts from the clean energy programs and policies in the IRA, BW Research used IMPLAN economic modeling software to estimate the overall economic benefits from publicly sourced clean energy project announcements. BW Research developed a dozen economic impact models in total to represent six tracked sectors: Solar, Wind, Electric Vehicle (EV), Electricity Transmission & Distribution (Electric T&D), Battery Storage, and Clean Fuels. Based on this common methodology and assumptions, BW generated outputs at the national level, including earnings, tax revenue, employment and overall GSP value add.

For more information on methodology, see Appendix B in the report. For the list of all 18 projects tracked by E2 in the first year of the IRA, see Appendix C.

For the latest full list of clean energy job announcements tracked by E2, visit https://e2.org/announcements.

About E2

E2 is a national, nonpartisan group of business leaders, investors, and professionals from every sector of the economy who advocate for smart policies that are good for the economy and good for the environment. E2 members have founded or funded more than 2,500 companies, created more than 600,000 jobs, and manage more than $100 billion in venture and private equity capital.

For additional insight into E2’s other reports, visit e2.org/reports.

View Report »

North Carolina Clean Economy Works | An Economic Impact Analysis of Major Clean Energy, Vehicle Projects

Date: March 21, 2024

Summary:

This analysis uses the original $86 billion in estimated capital expenditures that companies announced in investments nationwide for new developments and extrapolates another $20 billion in additional capital expenditures for project announcements that did not include a dollar amount or required an updated estimate based on available information. In addition to the direct benefits of these expenditures, new modeling from BW Research measures the broader economic benefits and the multiplier effect of the investments and jobs expected if the 210 announced projects were completed over the next five years.

When these broader economic benefits are factored in, BW’s modeling expects the nine large-scale North Carolina project announcements tracked by E2 between August 2022 and August 2023 to create or support 30,000 jobs and generate tens of billions of dollars in new wages, tax revenue, and economic growth.

These secondary economic benefits are far-reaching. When new clean energy projects and clean vehicle factories and thousands of new jobs come to a community, local restaurants sell more meals. Schools, police departments and local public works projects benefit from increases in local tax revenues. Local manufacturers and wholesalers sell more goods to feed the growing local supply chain. And small businesses such as accounting firms, construction contractors, landscaping companies and caterers see new revenue streams.

Together, these direct and indirect jobs and investments tell a statewide story of opportunity for domestic manufacturing, clean energy production, transportation and infrastructure modernization and American ingenuity, thanks to the clean energy incentives and investments made possible by the IRA.

They are also just the beginning as E2 continues to track new projects being announced every month

This field is for validation purposes and should be left unchanged.

Key Findings

This report details the economic impacts resulting from the clean energy investments in North Carolina that were announced after the passing of the IRA, allowing for a more detailed examination of the economic benefits that the clean energy investments bring to the state. The nine major North Carolina projects tracked by E2 between August 2022-August 2023 will create or support nearly 30,000 jobs, including 24,600 jobs each year during construction and another 5,400 jobs each year after.

These private-sector investments and jobs will add $10.2 billion to North Carolina’s Gross State Product (GSP) while the projects are under construction, and another $593.5 million annually once they are up and running.

Additionally, these projects will result in $2.1 billion in new tax revenues for federal, state, and local governments while under construction, and an additional $124.2 million annually after.

COMBINED JOBS, WAGE, TAX AND GSP IMPACTS OF MAJOR CLEAN ENERGY PROJECTS ANNOUNCED IN FIRST YEAR OF THE IRA

TOTAL INVESTMENTS INTO AND ANNUAL JOBS SUPPORTED BY CLEAN ENERGY PROJECTS, DETAILED BY ENERGY SECTOR

Sector Total Construction Phase Jobs (Annual jobs for 5 years) Annual Operations Phase Jobs (Annual jobs for lifetime of projects)
EV 23,678 5,208
Electrification, Grid, and Transmission 303 32
Battery / Storage 588 124
Total 24,569 5,365
Sector Total Capital Investment ($millions) Extrapolated Capital Investment ($millions) Total Capital Investment ($millions) Annual Operational Investment ($millions)
EV $9,663.70 $- $9,663.70 $966.37
Electrification, Grid, and Transmission $- $146.40 $146.40 $13.42
Battery / Storage $240.00 $- $240.00 $24.00
Total Capital Investment $9,903.70 $146.40 $10,050.10 $1,003.79

Methodology

This analysis provides a thorough economic prediction of the impacts of the nine announcements by filling in the gaps of publicly announced information. Modeled impacts differ from initial estimates offered by companies announcing new projects, tracked by E2. One of the nine announcements provided no capital investment estimate and two provided no job creation estimate. Additionally, those estimates were inconsistently defined, lacking clarity on if they are direct jobs only or direct, indirect, and induced jobs, and if they were for construction or permanent positions.

To analyze these economic impacts from the clean energy programs and policies in the IRA, BW Research used IMPLAN economic modeling software to estimate the overall economic benefits from publicly sourced clean energy project announcements. BW Research developed a dozen economic impact models in total to represent six tracked sectors: Solar, Wind, Electric Vehicle (EV), Electricity Transmission & Distribution (Electric T&D), Battery Storage, and Clean Fuels. Based on this common methodology and assumptions, BW generated outputs at the national level, including earnings, tax revenue, employment and overall GDP value add.

For more information on methodology, see Appendix B in the report. For the list of all nine projects tracked by E2 in the first year of the IRA, see Appendix C.

For the latest full list of clean energy job announcements tracked by E2, visit https://e2.org/announcements.

About E2

E2 is a national, nonpartisan group of business leaders, investors, and professionals from every sector of the economy who advocate for smart policies that are good for the economy and good for the environment. E2 members have founded or funded more than 2,500 companies, created more than 600,000 jobs, and manage more than $100 billion in venture and private equity capital.

For additional insight into E2’s other reports, visit e2.org/reports.

View Report »

Georgia Clean Economy Works | An Economic Impact Analysis of Major Clean Energy, Vehicle Projects

Date: February 15, 2024

Summary:

This analysis uses the original $86 billion in estimated capital expenditures that companies announced in investments nationwide for new developments and extrapolates another $20 billion in additional capital expenditures for project announcements that did not include a dollar amount or required an updated estimate based on available information. In addition to the direct benefits of these expenditures, new modeling from BW Research measures the broader economic benefits and the multiplier effect of the investments and jobs expected if the 210 announced projects were completed over the next five years.

When these broader economic benefits are factored in, BW’s modeling for the 19 major Georgia projects tracked by E2 between August 2022 and August 2023 expects the projects to create or support almost  39,000 jobs and generate tens of billions of dollars in new wages, tax revenue, and economic growth.

These secondary economic benefits are far-reaching. When new clean energy projects and clean vehicle factories and thousands of new jobs come to a community, local restaurants sell more meals. Schools, police departments and local public works projects benefit from increases in local tax revenues. Local manufacturers and wholesalers sell more goods to feed the growing local supply chain. And small businesses such as accounting firms, construction contractors, landscaping companies and caterers see new revenue streams.

Together, these direct and indirect jobs and investments tell a statewide story of opportunity for domestic manufacturing, clean energy production, transportation and infrastructure modernization and American ingenuity, thanks to the clean energy incentives and investments made possible by the IRA.

They are also just the beginning as E2 continues to track new projects being announced every month

This field is for validation purposes and should be left unchanged.

Key Findings

This report details the economic impacts resulting from the clean energy investments in Georgia that were announced after the passing of the IRA, allowing for a more detailed examination of the economic benefits that the clean energy investments bring to the state. The 19 major Georgia projects tracked by E2 between August 2022 and August 2023 will create or support 38,600 jobs, including 31,800 jobs each year during construction and another 6,800 jobs each year after that. 

These private-sector investments and jobs will add $13.9 billion to Georgia’s Gross State Product (GSP) while the projects are under construction, and another $926.5 million annually once they are up and running. 

Additionally, these projects will result in $2.6 billion in new tax revenues for federal, state, and local governments while under construction, and an additional $175.4 million annually after that. 

COMBINED JOBS, WAGE, TAX AND GSP IMPACTS OF MAJOR CLEAN ENERGY PROJECTS ANNOUNCED IN FIRST YEAR OF THE IRA

TOTAL INVESTMENTS INTO AND ANNUAL JOBS SUPPORTED BY CLEAN ENERGY PROJECTS, DETAILED BY ENERGY SECTOR

Sector Total Construction Phase Jobs (Annual jobs for 5 years) Annual Operations Phase Jobs (Annual jobs for lifetime of projects)
Solar 7,639 1,723
EV 15,678 3,281
Battery Storage 8,443 1,813
Total 31,760 6,817
Sector Total Capital Investment ($billions) Extrapolated Capital Investment ($billions) Total Capital Investment ($billions) Annual Operational Investment ($billions)
Solar $2.65 $0.42 $3.07 $0.30
EV $6.29 $0.00 $6.29 $0.63
Battery Storage $3.39 $0.00 $3.39 $0.34
Total Capital Investment $12.33 $0.42 $12.75 $1.27

Methodology

This analysis provides a thorough economic prediction of the impacts of the 19 announcements by filling in the gaps of publicly announced information. Modeled impacts differ from initial estimates offered by companies announcing new projects, tracked by E2. Two of the 19 announcements provided no capital investment estimate and one provided no job creation estimate. Additionally, those estimates were inconsistently defined, lacking clarity on if they are direct jobs only or direct, indirect, and induced jobs, and if they were for construction or permanent positions. 

To analyze these economic impacts from the clean energy programs and policies in the IRA, BW Research used IMPLAN economic modeling software to estimate the overall economic benefits from publicly sourced clean energy project announcements. BW Research developed a dozen economic impact models in total to represent six tracked sectors: Solar, Wind, Electric Vehicle (EV), Electricity Transmission & Distribution (Electric T&D), Battery Storage, and Clean Fuels. Based on this common methodology and assumptions, BW generated outputs at the national level, including earnings, tax revenue, employment and overall GDP value add.

For more information on methodology, see Appendix B in the report. For the list of all 19 projects tracked by E2 in the first year of the IRA, see Appendix C.

For the latest full list of clean energy job announcements tracked by E2, visit https://e2.org/announcements.

About E2

E2 is a national, nonpartisan group of business leaders, investors, and professionals from every sector of the economy who advocate for smart policies that are good for the economy and good for the environment. E2 members have founded or funded more than 2,500 companies, created more than 600,000 jobs, and manage more than $100 billion in venture and private equity capital.

For additional insight into E2’s other reports, visit e2.org/reports.

View Report »

Benefits to Rural America from the Inflation Reduction Act: Driving Jobs, Investment, and Economic Resilience

Date: January 11, 2024

Summary:

The positive impacts of the IRA’s historic investment in America’s rural economic growth and resilience are transformative. In its first year, the IRA incentives have spurred 52 major rural manufacturing projects that are projected to create 67,000 rural jobs and nearly $2 billion in worker income, creating viable new career opportunities and revenues to sustain rural communities. In addition to spurring growth, these IRA funds are essential to ensuring that rural America has access to the benefits of the clean economy transition and that our farms and farming communities are more profitable and more resilient. Farmers and rural workers across multiple industries, as well as rural consumers, strongly favor these investments in clean energy, infrastructure, and agricultural resilience. The federal clean economy investments in the IRA position rural communities as leaders in building a thriving 21st century American economy. 

This field is for validation purposes and should be left unchanged.

KEY FINDINGS:

The report includes new data and on-the-ground perspectives across three areas of economic outcomes:

I. Section 1 presents new data from E2 and BW Research Partnership on how the IRA clean energy tax incentives are driving a revitalization of rural manufacturing. Findings include:

// One of every four large-scale clean energy projects announced in the first year of the IRA is located in demographically rural areas—more than 50 total projects in 21 states

//$20 billion in investments in rural areas

//More than 67,000 new jobs in rural counties—including more than 21,000 permanent jobs that will pay nearly $2 billion to workers each year

// Almost $5 billion in new tax revenues in the near term, with an additional $700 million in revenue every year of operation, that can help support schools, first responders, and other essential public services provided by federal, state, county, and local governments

//Nearly $3 billion to the nation’s GDP in every year that the projects are operational

II. Section 2 shows that $12 billion in clean energy loan and grant programs made possible by the IRA significantly accelerates access for rural Americans to the economic benefits of renewable energy, and is an important step in ensuring that rural America is not left behind in the global transition to a clean energy economy. These IRA funds:

// Help the nation’s more than 900 rural electricity co-ops supply cleaner, more efficient, and more affordable energy to their members

// Make clean energy and energy efficiency projects more accessible for local businesses, community organizations, farms, ranches, and municipal buildings and facilities that want them

III. Section 3 details the benefits of the IRA investment of $20 billion over five years through the U.S. Department of Agriculture’s popular and over-subscribed voluntary conservation programs for farmers and ranchers. These IRA funds:

// Help farmers in their efforts to cut input costs, improve crop resilience and soil health, and boost their bottom lines

//Invest in programs and solutions that are overwhelmingly supported by Americans regardless of political affiliation

// Represent only a small part of the need to meet the demand for this support in rural America

Methodology

The following applies to Section 1 of the report and APPENDIX IV: Details by Clean Energy Sector. 

In November 2023, E2 and BW Research Partnership produced an analysis of the economic benefits of 210 major clean energy projects announced in the first year of the IRA. 

This report includes a more detailed analysis of the 52 announced in rural counties as defined by the USDA. 

As with the national analysis, this rural analysis required filling in the gaps of publicly announced information. Modeled impacts differ from initial estimates offered by companies announcing new projects tracked by E2. Some of the announcements provided no capital investment estimate and others provided no job creation estimate. Additionally, those estimates were inconsistently defined, lacking clarity on whether they are direct jobs only or direct, indirect, and induced jobs, and if they were for construction or permanent positions.

For more information on methodology, including investment extrapolation methods and impact modeling assumptions, see Appendix III in the report. For the list of all 52 projects in rural areas tracked by E2 in the first year of the IRA, see Appendix I.

For the latest full list of clean energy job announcements tracked by E2, visit https://e2.org/announcements.

About E2

E2 is a national, nonpartisan group of business leaders, investors, and professionals from every sector of the economy who advocate for smart policies that are good for the economy and good for the environment. E2 members have founded or funded more than 2,500 companies, created more than 600,000 jobs, and manage more than $100 billion in venture and private equity capital. Our members and supporters include farmers and other rural business leaders, professionals in rural clean energy and leaders in Ag-tech.

For additional insight into E2’s other reports, visit e2.org/reports.

View Report »

Clean Economy Works | An Economic Impact Analysis of Major Clean Energy Projects Announced In Year One of the Inflation Reduction Act

Date: November 1, 2023

Summary:

This analysis uses the original $86 billion in estimated capital expenditures that companies announced in investments for new developments and extrapolates another $20 billion in additional capital expenditures for project announcements that did not include a dollar amount or required an updated estimate based on available information. In addition to the direct benefits of these expenditures, new modeling from BW Research measures the broader economic benefits and the multiplier effect of the investments and jobs expected if the 210 announced projects were completed over the next five years.

When these broader economic benefits are factored in, BW’s modeling expects 403,000 new jobs—including nearly 100,000 permanent jobs—would be created and supported throughout the economy, $156 billion added to U.S. GDP, $111 billion in new wages for workers, and more than $32 billion generated in tax revenue for federal, state, and local governments. These benefits will continue long after the projects are built. For more details, see Key Findings below.

These secondary economic benefits are far-reaching. When new clean energy projects and clean vehicle factories and thousands of new jobs come to a community, local restaurants sell more meals. Schools, police departments and local public works projects benefit from increases in local tax revenues. Local manufacturers and wholesalers sell more goods to feed the growing local supply chain. And small businesses such as accounting firms, construction contractors, landscaping companies and caterers see new revenue streams.

Together, these direct and indirect jobs and investments tell a nationwide story of opportunity for domestic manufacturing, clean energy production, transportation and infrastructure modernization and American ingenuity, thanks to the clean energy incentives and investments made possible by the IRA.

They are also just the beginning as E2 continues to track new projects being announced every month

This field is for validation purposes and should be left unchanged.

Key Findings

This modeling shows that (if all projects are completed) the 210 major projects tracked by E2 between August 2022-August 2023 will create or support more than 400,000 jobs, including 303,500 construction jobs each year during construction and another 99,600 jobs each year after that.

These private-sector investments and jobs will add $155.5 billion to the nation’s GDP while the projects are under construction, and another $13.1 billion annually once they are up and running.

Additionally, these projects will result in $32.5 billion in new tax revenues for federal, state, and local governments while under construction, and an additional $2.9 billion annually after that.

COMBINED JOBS, WAGE, TAX AND GDP IMPACTS OF MAJOR CLEAN ENERGY PROJECTS ANNOUNCED IN FIRST YEAR OF THE IRA

TOTAL INVESTMENTS INTO AND ANNUAL JOBS SUPPORTED BY CLEAN ENERGY PROJECTS, DETAILED BY ENERGY SECTOR

Sector Total Construction Phase Jobs (Annual jobs for 5 years) Annual Operations Phase Jobs (Annual jobs for lifetime of projects) Sector Announced Capital Investment ($billions) Extrapolated Capital Investment ($billions) Total Capital Investment ($billions) Annual Operational Investment ($billions)
Solar 35,054 12,139 Solar $10.21 $1.94 $12.15 $1.35
Wind 7,046 5,933 Wind $1.64 $1.18 $2.82 $0.76
EV 185,673 54,500 EV $56.06 $5.52 $61.58 $6.16
Electric T&D 5,565 2,035 Electric T&D $1.46 $0.51 $1.97 $0.27
Battery Storage 48,795 13,633 Battery Storage $12.19 $5.61 $17.80 $1.90
Clean Fuels 21,322 11,342 Clean Fuels $5.09 $4.99 $10.08 $0.83
Total 303,455 99,584 Total Capital Investment $86.66 $19.74 $106.40 $11.27

Methodology

This analysis provides a thorough economic prediction of the impacts of the 210 announcements by filling in the gaps of publicly announced information. Modeled impacts differ from initial estimates offered by companies announcing new projects, tracked by E2. Fifty-six of the 210 announcements provided no capital investment estimate and sixty-eight provided no job creation estimate. Additionally, those estimates were inconsistently defined, lacking clarity on if they are direct jobs only or direct, indirect, and induced jobs, and if they were for construction or permanent positions.

To analyze these economic impacts from the clean energy programs and policies in the IRA, BW Research used IMPLAN economic modeling software to estimate the overall economic benefits from publicly sourced clean energy project announcements. BW Research developed a dozen economic impact models in total to represent six tracked sectors: Solar, Wind, Electric Vehicle (EV), Electricity Transmission & Distribution (Electric T&D), Battery Storage, and Clean Fuels. Based on this common methodology and assumptions, BW generated outputs at the national level, including earnings, tax revenue, employment and overall GDP value add.

For more information on methodology, see Appendix B in the report. For the list of all 210 projects tracked by E2 in the first year of the IRA, see Appendix C.

For the latest full list of clean energy job announcements tracked by E2, visit https://e2.org/announcements.

About E2

E2 is a national, nonpartisan group of business leaders, investors, and professionals from every sector of the economy who advocate for smart policies that are good for the economy and good for the environment. E2 members have founded or funded more than 2,500 companies, created more than 600,000 jobs, and manage more than $100 billion in venture and private equity capital.

For additional insight into E2’s other reports, visit e2.org/reports.

View Report »

Clean Economy Works | IRA One-Year Review

Date: August 14, 2023

Summary:

One year after the Inflation Reduction Act (IRA) was signed into law on August 16, 2022, private industry has announced at least 210 major new clean energy and clean vehicle projects across the country, according to E2’s findings. Based on publicly available information from 178 of the 210 announcements that included new jobs and/or investment estimates, if completed the projects would create at minimum 74,181 new jobs and bring in $86.3 billion in private investments.

These announcements are expected to drive a major boost in new clean energy jobs in the coming years, compared to clean energy employment growth before the IRA. Not including 2020 job losses fueled by COVID-19 shutdowns and ensuing economic crisis, clean energy has averaged an annual increase of 117,000 jobs since 2018. The jobs and investments estimated in the more than 200 announcements would represent a sizable increase in annual employment growth in clean energy and is indicative of a coming  wave of job gains on the horizon unequaled in the history of the clean energy sector — presuming normal employment gains based on overall market growth, projects announced and in development before the IRA was signed, and smaller investments and new projects that are unable to be tracked by this analysis. In addition, only 142 of the announcements included a temporary and/or permanent job creation estimate — leaving one-third of new announcements without any employment estimates as of the time of this analysis.

This field is for validation purposes and should be left unchanged.

Highlights

States Projects Est. Jobs Est. Investment
38 210 74,181 $86,320,800,000

* 54 of the 208 announcements did not include investment estimates and 68 did not include job estimates.

  • Electric vehicle and battery manufacturing accounted for more than half of all new projects, with 115 battery and EV factories or expansions announced.
  • Renewable energy companies announced 44 solar panel and equipment factories and major solar projects, and at least 18 wind turbine factories or major wind products.
  • Red states and Republican congressional districts are benefitting the most from the IRA. More than half of all projects were in Republican districts, and 18 of the top 20 congressional districts for clean energy investments are held by Republicans. About 60 percent of all jobs and investments announced were in Republican districts.
  • About 28 percent of congressional districts are home to at least one announced project.
  • The top congressional districts for clean energy investments are North Carolina’s 9th district with nearly $9.9 billion, represented by Republican Rep. Richard Hudson, Georgia’s 11th congressional district with $6.6 billion, represented by Republican Rep. Barry Loudermilk, and Nevada’s 2nd congressional district with $6.6 billion, represented by Republican Rep. Mark Amodei.
  • The top congressional districts that would see the largest clean energy employment growth from new clean energy projects are Georgia’s 11th district with 5,660 estimated jobs, represented by Republican Rep. Barry Loudermilk, Nevada’s 2nd congressional district with 5,050 jobs, represented by Republican Rep. Mark Amodei, and South Carolina’s 2nd congressional district with 4,600 jobs, represented by Republican Rep. Joe Wilson.
  • The top congressional districts that are home to the most projects announced are Ohio’s 9th congressional district with 6 projects, represented by Democratic Rep. Marcy Kaptur, and Georgia’s 1st congressional district with 5 projects, represented by Republican Rep. Earl Carter. Six other districts are home to four announced projects.
  • Foreign companies led or were involved with nearly 100 announced projects. U.S.-based companies led or were involved with 118 announced projects.
  • South Korean companies announced the most projects – more than two dozen. Companies based in Michigan, California, and North Carolina led announcements from domestic-based companies.
  • Manufacturing accounted for 171 projects, 91 percent of investments and 95 percent of jobs announced.
  • Seven states are home to 10 or more projects, including Georgia, South Carolina, Michigan, Ohio, Tennessee, Texas, and New York. A total of 31 states are home to at least 2 projects.

Methodology

The data used in this report is limited to information made publicly available by the companies announcing projects and may not be comprehensive of all major projects that began development after August 16, 2022, nor be exclusive of projects that did not publicly disclose specific plans prior to the passage of the IRA. Projects that began development, were proposed, or applied for local and state approval before the passage of the Inflation Reduction Act (IRA) are not included. This analysis also does not include federal investments in which the federal government has provided financial resources for the complete project, lease sales, projects in which an announcement was made but lacked specific geographic information, etc. Details on projects came from news reports on new and related projects, press releases from companies announcing new developments, and government announcements. 156 of the 210 announcements include investment data and 142 of the 210 announcements include job estimates, making this information very conservative. Some announcements did not include specific locations that could be used to identify congressional district information.

For the latest full list of clean energy job announcements tracked by E2, visit https://e2.org/announcements.

About E2

E2 is a national, nonpartisan group of business leaders, investors, and professionals from every sector of the economy who advocate for smart policies that are good for the economy and good for the environment. E2 members have founded or funded more than 2,500 companies, created more than 600,000 jobs, and manage more than $100 billion in venture and private equity capital.

For additional insight into E2’s other reports, visit e2.org/reports.

View Report »

Healthy Soils and Innovation: Cultivating Economic Security on America’s Farms

Date: July 18, 2023

The Rising Opportunity For Resilience In Rural America

Summary:

Innovation is at the heart of America’s farm tradition. Having proven over more than two centuries that they can thrive while dealing with uncertainty and unforeseen challenges, adapt to new circumstances often out of their control, and innovate practical solutions to ongoing change, America’s farmers are proven entrepreneurs. Whether it’s rising input costs, fluctuating commodity prices and tariffs, or market disruptions based on events thousands of miles away, farmers are skilled at seizing the opportunities in adversity.

Now the agriculture industry increasingly faces unprecedented challenges from severe and unseasonable weather, putting practices that were effective in past decades in question. Out of necessity, farmers and ranchers are experimenting with and adopting forward-thinking methods to ensure that their operations, both large and small, survive and thrive in the face of these swiftly evolving circumstances.

More than ever, American farmers need the support and freedom to innovate. But U.S. federal farm policies do not sufficiently incentivize, and in many cases hinder, this farmer-led entrepreneurial activity. The 2023 Farm Bill represents a timely and strategic opportunity to greatly increase investment and innovation in new practices and technologies that:

  • restore and increase soil health
  • reduce farm input costs
  • boost crop resilience to extreme weather events while reducing crop loss risk and insurance costs
  • store atmospheric carbon and mitigate climate change
  • enhance additional ecosystem benefits such as reduced soil erosion and input runoff, improved water and air quality, and increased biodiversity
  • bolster economies of hard-hit communities in rural America

These economic and environmental benefits can be achieved through three policies in the 2023 Farm Bill that will incentivize and promote the freedom to innovate that so many farmers are demanding to manage their operations for maximum health and productivity.

The next decade represents a critical window to enact policies that address the climate challenge. It’s imperative that the next Farm Bill helps transform U.S. agriculture to meet 21st century challenges with a framework that robustly incentivizes innovation—and actively partners with the producers, Ag tech, equipment and input companies, consumer product companies and consumers, and other stakeholders who are leading the Ag sector to a new, innovative, and economically sustainable future.

This field is for validation purposes and should be left unchanged.

A  Report on Three Policy Opportunities

Include The Healthy Soils Healthy Climate Act

The 2018 Farm Bill introduced a new program, On-Farm Conservation Innovation Trials, under the USDA’s Natural Resources Conservation Service (NRCS). The program included the Soil Health Demonstration Trial (SHDT) program with a specific focus on practices and innovations to improve soil health. Hundreds of farmers and ranchers in nearly all 50 states are now participating in SHDT trials, and many more would like to. As called for in the Healthy Soils Healthy Climate Act introduced in Congress6, the 2023 Farm Bill should greatly expand the SHDT program and make it permanent.

Create And Fund An Advanced Research And Innovation Hub Within the U.S. Department of Agriculture

With the emergence of Ag Tech as a potentially transformational and fast-growing investment sector in recent years—akin to the clean-energy sector in 2009—Congress should create and fund an entity comparable to ARPA-E within USDA to support and accelerate private and academic R&D in future-focused Ag areas such as soil health data collection and measurement; farm robotics; precision Ag management software; and bio-based fertilizers, herbicides, and pesticides. The new entity should create partnerships with other relevant agencies such as EPA, DOE, DOD and National Labs, as well as land grant universities across the U.S. These federally funded research hubs will bring high-quality jobs, both directly and indirectly through p

Include the Cover Act

Crop insurance has been a cornerstone of U.S. federal agriculture policy and an essential economic safety net for America’s farmers for nearly a century. Under policies administered by the USDA’s Risk Management Agency (RMA), some 90% of all farmed acres in the U.S. are covered by federal crop insurance. However, some crop insurance policies have become a barrier to best practices and have reduced producers’ ability to innovate for crop resilience in their specific regions and on their individual farms. And the current system costs U.S. taxpayers billions of dollars every year.

Related Reports

About E2

E2 is a national, nonpartisan group of business leaders, investors, and professionals from every sector of the economy who advocate for smart policies that are good for the economy and good for the environment. E2 members have founded or funded more than 2,500 companies, created more than 600,000 jobs, and manage more than $100 billion in venture and private equity capital.

For additional insight into E2’s other reports, visit e2.org/reports.

View Report »

Sign Up for Email Updates


  • This field is for validation purposes and should be left unchanged.

Our Latest Press Releases


Releases

E2: Senate “Slams Brakes” on Made-in-USA Energy, Putting Projects, Jobs and Energy Security At Risk

WASHINGTON (July 1, 2025) – The U.S. Senate passed a massive tax and spending bill that will phase out and repeal federal tax policies creating jobs, driving new investments in manufacturing, and increasing American energy production. Businesses have ann...


Releases

Businesses Cancel $1.4 Billion In New Factories, Energy Projects in May as Congress Pushes Forward on Tax Increases

Cancellations now total $15.5 billion since January; nearly 12,000 jobs lost GOP districts see $9 billion in investments; 10,000 jobs disappear due to cancelled or delayed projects so far $444 million in new investments announced in M...


Releases

Senate Bill Threatens Investments, Jobs, Energy Security

Federal tax policies that are creating jobs and increasing America’s energy supplies would be phased out or repealed in new language released by the Senate Finance Committee today as part of President Trump’s massive tax and spending package.


Donate Today