WASHINGTON, DC – The core of President Biden’s Build Back Better agenda is set up for a vote in Congress in the House as early as tonight. If passed and signed into law, the Build Back Better Act would represent the largest federal investment in the economy and combatting climate change. Statement from Sandra Purohit, […]
Kentucky’s 6th Congressional District in Lexington currently hosts 4,760 clean energy jobs according to a new national report by a nonpartisan group advocating for more investment. E2, which bills itself as a business group advocating for policies both beneficial to the economy and the environment, released the study on Monday to show there’s nearly as […]
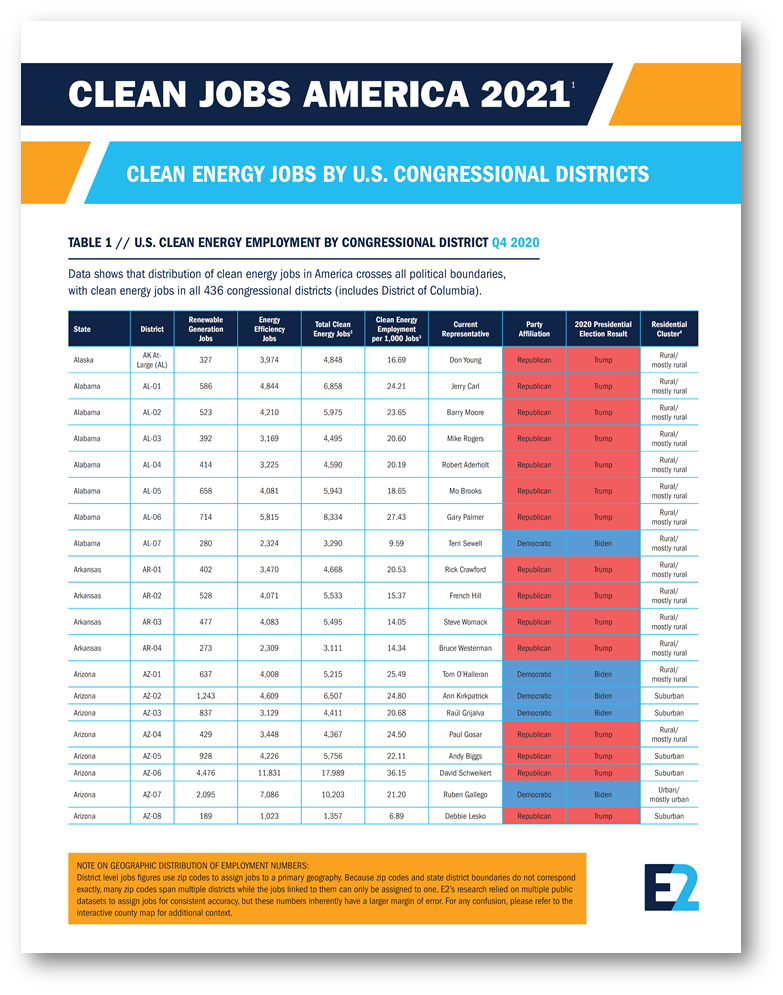
Data shows “there’s nothing partisan or political about clean energy jobs.” WASHINGTON (November 1, 2021) – As Congress prepares to vote on the biggest U.S. investments ever in clean energy and the COP26 international climate summit begins in Scotland, a new analysis shows that America’s more than 3 million clean energy jobs are nearly evenly […]
The nation’s more than 3 million clean-energy jobs are nearly evenly split across Republican and Democratic congressional districts, new research out Monday shows. Nonprofit E2, which tracks clean-energy initiatives, particularly jobs in renewable energy, electric-vehicle manufacturing and electric-grid modernization, conducted the research with outside firm BW Research. Democratic-led districts make up 54.3%, while Republican-led districts account for […]
Download the Full ChartExplore the Congressional District Map
Every Day, 3 Million AmericansAcross all 435 Congressional Districts Work Building Our Clean Energy Economy.
Clean energy is a critical job creator in every state – employing 1 in every 50 American workers. More Americans today work in clean energy than as lawyers, police officers, farmers, firefighters, kindergarten teachers, and mail carriers combined.
432 Districts Have >1,000 clean energy jobs
388 Districts Have >3,000 clean energy jobs
279 Districts Have >5,000 clean energy jobs
79 Districts Have >10,000 clean energy jobs
Residential Density
Suburban: 39.7% (1,211,306 clean energy job)
Rural or mostly rural: 38.6% (1,175,937 jobs)
Urban or mostly urban: 21.7% (661,360 jobs)
Download the complete report and explore the national map at at this link.
ABOUT THE REPORT
The analysis expands on Clean Jobs America 2021 and is based on preliminary employment data collected and analyzed by BW Research Partnership for the 2021 U.S. Energy and Employment Report (USEER) released by the Department of Energy (DOE). The USEER analyzes data from the U.S. Bureau of Labor Statistics (BLS) Quarterly Census of Employment and Wages (QCEW) to track employment across many energy production, transmission, and distribution subsectors. For more information on the methodology click here
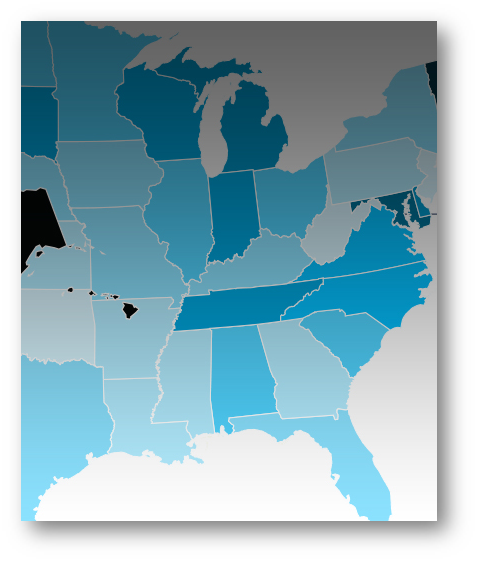
Job Density
Clean energy job density calculations for congressional districts used the U.S. Census Bureau 2019 County Business Patterns and the Bureau of Labor Statistics (BLS) 2020 Q4 QCEW employment data, analyzed and extrapolated by BW Research.
Residential Clusters
This report uses the CityLab Congressional Density Index (CDI) by David Montgomery to define congressional district residential clusters. Methodology for the CDI is available here. To condense the definitions into three categpories, this analysis combines:
“Pure rural” and “Rural-suburban mix” clusters into “Rural/mostly rural”
“Dense suburban” and “Sparse suburban” clusters into “Suburban”
“Pure urban” and Urban-suburban mix” clusters into “Urban/mostly urban”
What Jobs We Include
This analysis defines clean energy employment as jobs in solar energy, wind energy, combined heat and power, bioenergy, non-woody biomass, low-impact hydro power, geothermal, clean vehicle technologies, clean energy storage, smart grid, micro grid, grid modernization, advanced biofuels, and energy efficiency including ENERGYSTAR and high efficiency appliances, efficient lighting, HVAC, renewable heating and cooling, and advanced building materials. Jobs in retail trade, repair services, water or waste management, and indirect employment or induced employment are not included.
Note On Geographic Distribution Of Employment Numbers
District level jobs figures use zip codes to assign jobs to a primary geography. Because zip codes and state district boundaries do not correspond exactly, many zip codes span multiple districts while the jobs linked to them can only be assigned to one. Research relied on multiple public datasets to assign jobs for consistent accuracy, but these numbers inherently have a larger margin of error than state and county findings.
WASHINGTON, DC (October 28, 2021) – The White House and congressional negotiators today unveiled the framework for the budget reconciliation package to be passed alongside the bipartisan infrastructure legislation and implement the core of President Biden’s Build Back Better agenda. Statement from Bob Keefe, E2 Executive Director: “Our economy, our workforce, and our planet have […]
Passage of this bill will also significantly benefit Chicago’s Black and brown communities. A 2020 study from E2, or Environmental Entrepreneurs, showed that Black and Latino residents in Illinois are twice as likely to live in communities with the most lead service lines — yet another addition to the array of disproportionate threats to their […]
As national momentum builds towards a decarbonized transportation sector, the Southeast is experiencing substantial growth across the transportation electrification space, from electric vehicle manufacturing investment and employment to charging infrastructure and EV sales. However, with much of the Southeast lagging the national average for EV sales, there is still much more work to be done […]
And employers are hard up for hiring to complete the jobs they have. There are more than 2.1 million energy efficiency jobs in the U.S., according to the report out this week from E2, a national, nonpartisan group of energy investors and E4TheFuture, a nonprofit organization… …Of the 12 million residences in the U.S., 80% are […]
HUNTINGTON BEACH, CA – With new forecasts raising fears that the growing Southern California oil spill could soon reach more coastal areas, organizations representing thousands of ocean economy businesses redoubled calls for Congress to immediately and permanently prevent the expansion of offshore drilling and expand clean energy though the Build Back Better Act. Vipe Desai, […]
New state-by-state data reveals jobs lost to pandemic and details ongoing recovery WASHINGTON— A new report finds that while more than 2.1 million Americans now work in energy efficiency — which is more than work in any other sector of the U.S. energy industry, including oil, gas and coal — energy efficiency employment still has not […]
AMERICA’S ENERGY EFFICIENCY WORKFORCE: REDUCES COSTS, DRIVES ECONOMIC GROWTH
Summary
More than 2.1 million Americans now work in energy efficiency (EE), representing the biggest part of the entire energy sector. Workers in every state and community pull on their gloves and boots daily to help make our homes, offices, schools and other buildings more efficient. And some “boot up” in an office rather than out in the field, like developers of advanced energy management software, architects and designers, and administrative staff.
Whether EE workers upgrade heating/cooling systems or improve building enclosures, manufacture Energy Star equipment and appliances or install advanced lighting systems, they’re also helping American consumers, businesses and local governments to save money, reduce emissions and fight climate change.
This report details the size of this important employment sector, including its continued recovery from the impacts of the COVID-19 pandemic and how smart public investments now including the infrastructure and President Biden’s Build Back Better agenda can make our entire economy more resilient, drive growth, and create new jobs in every part of the country while while helping to address the threat of climate change.
The 2021 Energy Efficiency Jobs in America report includes an 15-page national summary and individual factsheets for all 50 U.S. states and the District of Columbia that include more detailed findings including job totals for every congressional and legislative district, industry and technology breakdowns, demographics, and maps of every state’s top counties.
This annual report focuses solely on the energy sector of the economy. Jobs in retail trade, vehicle efficiency-related work, and the 4.2 million jobs related to efficient manufacturing processes are excluded from these numbers.
Download
To download the national summary, click here or the report cover above.
For questions on this report, methodology, reported job numbers, or requests for specific additional data, email E2 Communications Director Michael Timberlake ([email protected]). An FAQ for the report, including answers to questions on methodology, is available here.
The EPA officially revoked the endangerment finding for greenhouse gas (GHG) emissions and eliminated clean vehicle standards in a blow to both our economy and our environment.
Businesses abandoned $5.1 billion in large-scale factories and clean energy projects in December, capping a turbulent year for the sector that saw nearly $35 billion in investments disappear along with more than 38,000 current and future jobs, according to ...
The Trump administration is trying to halt offshore wind projects that are well-underway just two weeks after their initial attempt was deemed arbitrary and capricious by a federal judge.
December 22 2025
Donate Today
Make a donation to help E2 advance policies that are good for the economy and good for the environment. Your donation is 100% tax-deductible from our partner, the NRDC.
Please contact E2 Membership Director Ying Li at [email protected] or 212-727-4437 for stock and wire transfer instructions.
For stocks, alert us to the transfer and provide the name of the stock and the number of shares being donated. This will help us track your donation internally and enable NRDC to provide an accurate gift receipt in a timely fashion.
Donations to E2 go directly to NRDC, a 501(c)3, and are fully tax-deductible (Federal Tax ID: 13-2654926). E2 collects no funds. NRDC provides full-time staffing dedicated to E2, as well as administrative, communications, legislative and analyst/policy support for the work of E2.
By Check
Make personal, Foundation or Donor Advised Fund checks payable to NRDC (indicate your donation is for E2 Membership to expedite processing) and send to:
Natural Resources Defense Council
Attn: Gift Processing
40 West 20th Street, 11th floor
New York, NY 10011