Building Opportunity: New York
The Jobs, Economic and Equity Benefits of Decarbonizing
and Electrifying Buildings Across the Empire State
Summary
New York State is home to more than 120,000 workers engaged in work directly related to decarbonizing and electrifying buildings across the state. This includes work like installing electric induction stoves in apartment buildings on Staten Island, replacing old insulation in the attics of single-family homes in Plattsburgh and fitting new pipes for geothermal heating and cooling systems in commercial buildings in Rochester.
To better understand how decarbonizing and electrifying New York’s buildings would impact the state’s labor market, E2 took a deeper dive into the state’s overall building decarbonization and electrification employment data.
By looking at five employment areas — technology; value chain; residential and commercial energy efficiency; electrification, building envelope and other energy efficiency; and a specific occupational analysis — we found that:
- In New York State, building decarbonization and electrification employment is 2.2 times greater than employment in fossil fuels as they relate to buildings.
- While New York City, Long Island and the mid-Hudson Valley are home to the majority of the state’s building decarbonization and electrification jobs, Western New York, the Finger Lakes, Central New York, the Southern Tier, the North Country and every other region in the state is home to thousands of building decarbonization workers, and all counties and regions stand to gain from stronger building decarbonization and electrification policies.
- Statewide, there are 73,000 workers involved in residential building decarbonization; nearly 48,000 work helping to decarbonize commercial buildings, suggesting broad opportunities across the state’s building stock, from ranch houses to apartments and high-rise office buildings to commercial buildings and industrial parks.
- In 2020, average annual wages for five occupations within building decarbonization and electrification in New York State ranged from $48,800 (for workers who are involved in insulation, floors, ceilings and walls) to $81,200 (electricians)
- The education required for entry-level jobs and the on-the-job training received varies
depending on the occupation, suggesting a broad range of opportunities for workers
across New York State.
Building Decarbonization and Electrification Employment by Technology, 2020
| Energy Star | 36,005 |
| High Efficiency HVAC & Renewable H&C | 35,315 |
| Traditional HVAC | 32,520 |
| Other | 8,993 |
| Advanced Materials & Insulation | 8,128 |
| Total | 120,961 |
Jobs Growth Potential
While 120,000 workers represent a sizable segment of New York State’s current overall labor force, the number of people who work on building decarbonization and electrification is expected to dramatically increase in the coming decades. By 2050, over 400,000 New Yorkers could be expected to work in building decarbonization and electrification — nearly four times as many as today.
Policy Leading the Way
Power sector policies have helped put New York at the center of the nation’s rapidly growing clean energy industry. In 2019 the state enacted the Climate Leadership and Community Protection Act (CLCPA), which sets targets and timelines for economy-wide emissions reductions, requires at least 35 percent of climate action benefits directly impact environmental justice and disadvantaged communities, and establishes the New York Climate Action Council (CAC) to oversee the efforts required to meet these nation-leading climate and equity commitments.
The state is already on track to meet CLCPA goals of sourcing 70 percent of its electricity supply from renewable energy by 2030, and making it 100 percent emissions-free by 2040. With buildings now representing a significant portion of economy-wide emissions, additional policies that could help equitably accelerate this shift include: better building codes; standards that help make appliances and other equipment found in residences and commercial buildings more efficient; statewide legislation that helps modernize new buildings; facilitating more disclosure of how buildings consume energy; eliminating fossil fuel subsidies while aligning incentives with state and local climate goals; and scaling up green, affordable housing.
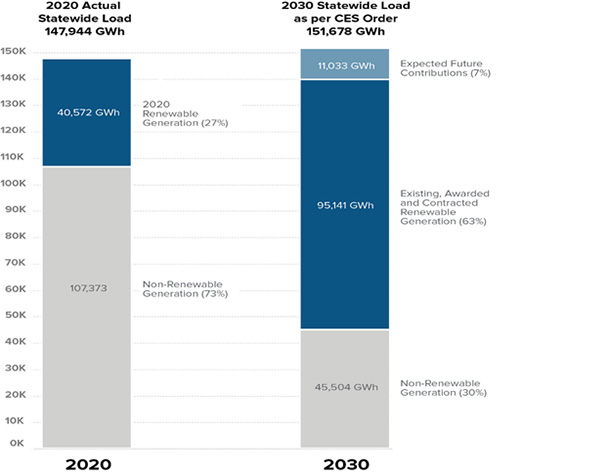
Credit: NYSERDA.
DOWNLOAD
Download the complete report at at this link.
BACKGROUND
This is the first Building Opportunity: New York report produced by E2 based on analysis of the USEER, which was first released by the DOE in 2016. E2 was an original proponent of the DOE producing the USEER and was a partner on the reports produced by the Energy Futures Initiative (EFI) and National Association of State Energy Officials (NASEO) after the Trump administration abandoned it in 2017.
View Report »