Women, Black, and Hispanic/Latino Workers Underrepresented in US Clean Energy WASHINGTON – As Congress considers the most significant domestic investment ever made to speed America’s transition to clean energy, a new employment report from a collaboration of business, equity, and energy organizations highlights the need for Congress to include funding to advance diversity in clean energy […]
Despite its broad range of businesses, including construction, utilities, manufacturing, professional services, and repair and maintenance, the clean energy sector is dominated by white men. Given the incredible job growth of the energy sector over the past decade, this lack of diversity threatens to cause women, Hispanic and Latino workers, and Black workers in particular to miss out on one of America’s great economic expansions.
About 61 percent of clean energy workers across America are white non-Hispanics. Black and Hispanic/Latino workers are more poorly represented in clean energy than they are across the rest of the economy, with Black people composing 8 percent of the clean energy workforce (compared with 13 percent economy-wide) and Hispanic/Latinos making up 16.5 percent (versus 18 percent economy-wide). Women represent less than 30 percent of all workers in the sector despite accounting for nearly half (48 percent) of the U.S. labor force as a whole.
As the United States looks to build back a better, cleaner, more equitable economy, a renewed focus on increasing diversity in the clean energy sector should be an economic imperative. Both the transition to a low-carbon energy system and proposed state and federal stimulus to boost the economy have the potential to create millions of new jobs across the United States. Policies that support the energy sector and its low-carbon transition should focus on the inclusion of women and underrepresented ethnic and racial groups, particularly Black workers (who are often the most poorly represented in the sector), so that economic benefits are more equitably shared.
Black workers represent about 8 percent of the clean energy labor force, compared with about 13 percent of the nation’s total workforce.
Hispanic/Latino workers represent nearly 17 percent of the clean energy workforce, slightly less than the 18 percent they represent in the overall national workforce.
Racial and ethnic minorities account for nearly four in ten U.S. clean energy workers.
About 8 percent of clean energy workers are Asian, slightly higher than their presence in the national workforce, while Pacific Islanders and Alaska and other native Americans each make up about 1 percent of the clean energy workforce.
Women hold about 27 percent of clean energy jobs, compared with 48 percent of all jobs nationally.
Renewable energy employs the highest share of Hispanic or Latino workers in the U.S. energy sector.
Black, Asian, Indigenous, and multiracial workers account for about 27 percent of clean energy jobs.
The full report includes national and state-by-state breakdowns on demographics across all clean energy sectors, multi-year demographic trends, comparisons to other energy sectors including fossil fuels and gas and diesel vehicles, and specific findings on individual occupations.
U.S. Labor Force Demographics, 2020
Demographic
Overall US Labor Force
Total Energy Workforce
Clean Energy Workforce
Fossil Fuel Workforce
White
76%
74%
73%
74%
Black/African-American
13%
10%
8%
9%
Asian
7%
7%
8%
6%
Native Hawaiian or other Pacific Islander
<1%
1%
1%
<1%
American Indian or Alaska Native
<1%
2%
1%
2%
Two or more races
2%
8%
8%
9%
People of Color
22%
28%
26%
26%
Hispanic/Latino
18%
16%
17%
13%
Women
48%
25%
27%
27%
Policies Matter
This analysis indicates that more needs to be done to address racial inequities in clean energy and the broader economy. As we rebuild the U.S. economy in the wake of COVID-19, we have a chance to do it in ways that create new opportunities for people of color. As Congress and state lawmakers focus on clean energy’s role in the recovery, they should focus as well on rebuilding the economy more equitably.
President Biden’s Justice40 initiative mandating that 40 percent of the benefits from federal climate action go to disadvantaged communities is a step in the right direction. But there are many steps lawmakers can take—right now—to ensure greater diversity in the clean energy workforce in the months and years ahead.
This is the first-ever comprehensive report on diversity in the U.S. clean energy workforce. This analysis was conducted by BW Research Partnership for E2, the Alliance to Save Energy, the American Association of Blacks in Energy, Black Owners of Solar Services (BOSS), and Energy Efficiency for All. Early drafts of this report were also reviewed by the Policy Committee of BOSS. It expands on data from the 2021 U.S. Energy and Employment Report (USEER) produced by the Department of Energy, using data collected and analyzed by BW Research Partnership. The USEER analyzes data from the U.S. Bureau of Labor Statistics Quarterly Census of Employment and Wages to track employment across many energy production, transmission, and distribution subsectors. For further methodology questions, see pages 201–206 of the USEER.
America’s Clean Energy Powerhouse in the Wake of Covid-19
Summary:
Driven by the unforeseeable impact of last year’s pandemic and resulting economic crisis, California experienced its first decline in clean energy jobs in 2020 since E2 began tracking such occupations. California’s clean energy economy employed about 480,000 Californians at the end of 2020, down from 537,000 the year before.
However, since the sector’s losses peaked at the end of May 2020, jobs grew back by more than 13 percent compared to less than 6 percent in statewide economy overall. In fact, by the end of 2020 more than half of the clean energy jobs lost between March and May had been regained, leaving the sector down just 9 percent (about 52,000 jobs) since COVID-19. Thanks to decades of smart state climate policy leadership, California’s clean energy economy has proven to not only be a core part of the state’s economy – representing 3 percent of overall state employment – but resilient and robust in the face of crushing economy-wide pressures.
Findings
Despite the overall decline, clean energy remains the biggest job creator across America’s energy sector:
Clean energy employs nearly six times as many workers as work in fossil fuel extraction and generation
More Californians still work in clean energy than work as registered nurses, accountants, lawyers, software designers, or truck drivers.
Median hourly wages for clean energy jobs also are about 29 percent higher than the statewide median wage.
Over half of the state’s clean energy jobs – 244,790 – were in construction with the clean energy economy employing 28 percent of the state’s entire construction workforce.
Colorado Clean Energy Employment, 2020
Energy Efficiency
283,839
Renewables
130,403
Clean Vehicles
42,503
Storage and Grid
22,638
Clean Fuels
5,597
TOTAL
484,980
Policies Matter
While clean energy suffered like many sectors of the economy in 2020, the prospects for growth are greater than ever as detailed in this report. Smart public policy leadership created the market environment to position California’s clean energy economy as a global leader over the last 20 years. Furthermore, policies that drive clean energy investments and job growth can also help mitigate the human toll and the economic cost of climate including the over $100 billion lost to extreme weather events in the U.S. in the last year alone. Climate risk is business risk.
Members of Congress can turn risk into opportunity by passing a robust American Jobs Plan anchored in clean energy investments to fund grid modernization, energy efficiency and electric vehicle charging networks at scale to form the backbone of a cleaner, more resilient economy. California lawmakers must build on existing state climate policy leadership to ensure the state remains a hub of job growth and innovation. Lawmakers must codify our state’s carbon neutrality goals while tightening our emissions mitigation targets, and continue to build out complementary policies to drive climate action to meet these goals.
Background
This is the fourth annual Clean Jobs California report produced by E2 based on analysis of the USEER, which was first released by the DOE in 2016. E2 was an original proponent of the DOE producing the USEER and was a partner on the reports produced by the Energy Futures Initiative (EFI) and National Association of State Energy Officials (NASEO) after the Trump administration abandoned it in 2017.
For additional insight into E2’s Clean Jobs California or our other annual clean energy economic reports, visit e2.org/reports.
The pandemic drove employment in Minnesota’s renewable energy and conservation businesses down 10% to 55,329 last year, disrupting several years of double-digit growth. … The report was released by sponsors E2 (Environmental Entrepreneurs) and nonprofits Clean Energy Trust and Clean Energy Economy Minnesota amid revelations that wind-and-solar power have become the cheapest forms of electrical […]
California is already suffering dire economic impacts from the effects of climate change, presenting significant business and economic risk to the world’s fifth largest economy. The costs of extreme climate events such as wildfires and droughts have risen steadily throughout the past decade, and are projected to increase dramatically in California if current trajectories continue. These costs are being borne by everyone who lives, pays taxes, buys insurance, or works in California.
At the same time, aggressively addressing climate change — reducing greenhouse gas emissions while growing the state’s clean energy economy — presents one of the greatest economic opportunities of the 21st century. Ambitious climate action produces robust job creation, sustainable economic growth, and California leading global innovation across a wide range of industry sectors. Members of Congress can seize this opportunity by passing a bold American Jobs Plan anchored in clean energy investments; California lawmakers must build on existing state climate policy leadership to ensure the state remains a nexus of investment and innovation in the 21st-century economy.
Findings
$55 Billion in direct property damage from California wildfires, 2017 – 2020
$47 billion in economic activity in California’s clean ocean economy under threat from sea level rise and ocean warming
$50.5 billion in overall production value of California’s 77,500 farms, which now face regular threats from droughts and other climate change-related impacts.
484,980 jobs – Nearly a half million Californians are employed in the clean energy economy, representing 285 of the state’s construction workers and 3% of California’s economy-wide workforce
#1 export – Electric vehicles were the state’s most valuable export in 2020, producing nearly $5.7 billion in revenue
About this Report
This report reviews and compares the damage to California’s economy from recent climate-related disasters and risks from future unabated climate change to the potential impact specific climate action policies could have on job and economic growth in the state’s core industries such as technology, construction, agriculture, and tourism. The report, made possible by the Leslie and Susan Gonda (Goldschmied) Foundation, uses publicly-available information and data from previous E2 analysis, BW Research, state and federal agencies, the University of California system, and other sources.
Looking for More Info?
If you are looking for additional insight into the clean economy and how it drives job growth, please see E2’s other clean energy employment reports, visit e2.org/reports.
Missouri’s clean energy job market faced a considerable decline during 2020’s economic downturn but still managed to bounce back by the end of the year, according to a recent study. More than 9,300 clean energy workers filed for unemployment in Missouri at the peak of the economic crisis tied to the COVID-19 pandemic, according to the 2020 Clean Jobs Midwest report from […]
The COVID-19 pandemic hit the Midwest clean energy job market hard, with more than 17,000 workers at one point filing for unemployment. But the industry appears to be rebounding, according to an analysis of employment data released by the nonpartisan business group E2 (Environmental Entrepreneurs) and Clean Energy Trust. Clean energy companies employed 113,456 Michiganders at the […]
According to the nonpartisan business group E2, or Environmental Entrepreneurs, more than 115,000 Illinoisans worked in the clean energy sector at the end of last year, with workers in all of the state’s 102 counties. The final 2020 job numbers show an 8.2% drop in Illinois’ clean energy workforce from 2019, representing more than 10,000 […]
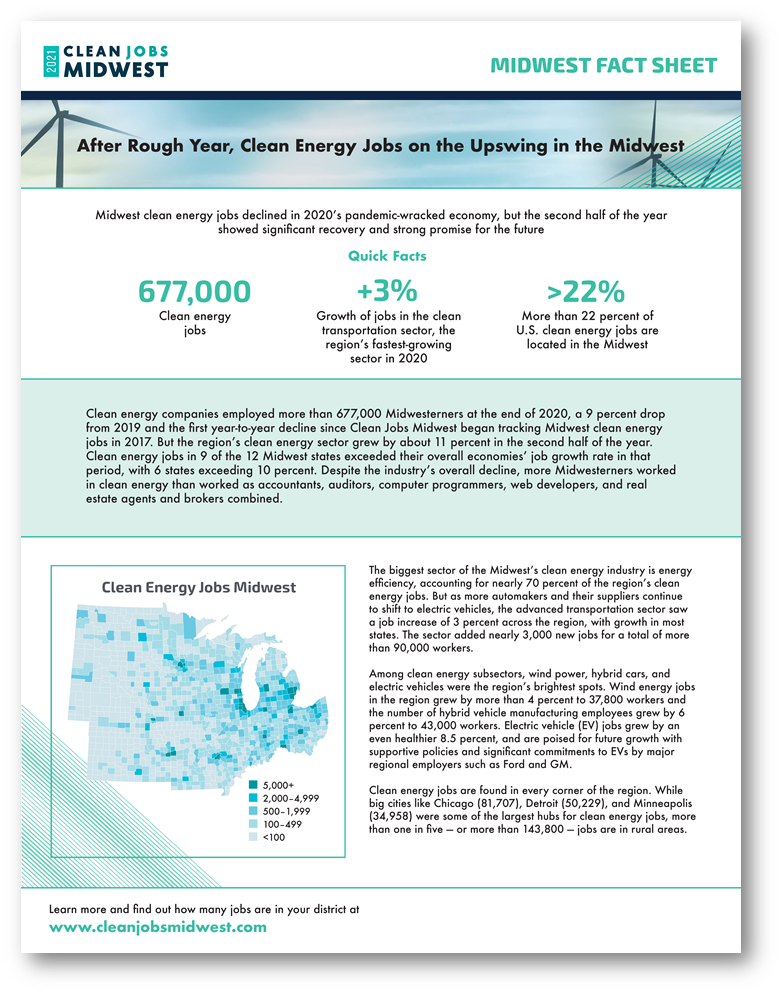
After Rough Year, Clean Energy Jobs on the Upswing in the Midwest
More than 677,900 Midwesterners worked in clean energy and clean vehicles at the end of 2020, making the sector a major – and promising – part of the region’s economy, according to this comprehensive analysis of employment data.
Like most of the economy, clean energy was hit hard by the COVID-19 pandemic and economic downturn in 2020. According to this year’s Clean Jobs Midwest, 2020 was the first year-to-year decline since E2 and Clean Energy Trust began tracking Midwest clean energy jobs. At one point, more than 131,600 Midwest clean energy workers had filed for unemployment, but the sector surged back 10.7 percent in the second half of the year to recover more than half of the jobs initially lost. The final 2020 job numbers represent an 8.9 percent drop in the Midwest clean energy workforce from 2019, or 66,100 jobs. Last year’s job losses were a dramatic change of pace for the industry. Last year’s job losses were a dramatic change of pace for the industry. In the 3 years leading up to 2020, for example, clean energy jobs grew almost 4 times as fast as overall employment.
MIDWEST HIGHLIGHTS
Energy Efficiency – 470,651 jobs
Clean Vehicles – 90,652 jobs
Renewable Energy – 84,881 jobs
Grid & Storage – 24,209 jobs
Clean Fuels – 7,525 jobs
ALL Clean Energy Sectors – 677,918 jobs
OTHER KEY FINDINGS
The biggest sector of the Midwest’s clean energy industry is energy efficiency, accounting for nearly 70 percent of the region’s clean energy jobs. But as more automakers and their suppliers continue to shift to electric vehicles, the advanced transportation sector saw a job increase of 3 percent across the region, with growth in most states. The sector added nearly 3,000 new jobs for a total of more than 90,000 workers.
Among clean energy subsectors, wind power, hybrid cars, and electric vehicles were the region’s brightest spots. Wind energy jobs in the region grew by more than 4 percent to 37,800 workers and the number of hybrid vehicle manufacturing employees grew by 6 percent to 43,000 workers. Electric vehicle (EV) jobs grew by an even healthier 8.5 percent, and are poised for future growth with supportive policies and significant commitments to EVs by major regional employers such as Ford and GM.
Clean energy jobs are found in every corner of the region. While big cities like Chicago (81,707), Detroit (50,229), and Minneapolis (34,958) were some of the largest hubs for clean energy jobs, more than one in five — or more than 143,800 — jobs are in rural areas.
DOWNLOAD
The complete report along with interactive breakdowns for all states is available at this link.
WASHINGTON, DC – Replacing all of America’s lead service lines would create 56,000 jobs that will last at least 10 years (560,000 job-years) and inject about $104 billion into the nation’s economy, a new study from E2 (Environmental Entrepreneurs) and the United Association of Union Plumbers & Pipefitters (UA) shows. Based on the Biden administration’s […]
Based on the Biden administration’s plans to invest $45 billion to replace 100 percent of lead service lines in America, the findings from Getting the Lead Out: Employment & Economic Impacts from Replacing America’s Lead Service Lines, this report from E2 and the United Association of Union Plumbers & Pipefitters (UA) estimates that the $45 billion invested in this program will create and support 56,080 jobs annually for 10 years, or a total of 560,800 job-years. This annual estimate includes 26,900 direct jobs—construction workers, plumbers, pipefitters, heavy equipment operators—as a direct result of this activity. Another 13,600 jobs that last for 10 years are created throughout the value chain, and 13,800 jobs are created each year for 10 years as a result of workers spending their paycheck.
About 84 percent of all jobs created through this investment are in construction (52 percent), professional and business services (24 percent), and manufacturing industries (8 percent). Insofar as the bulk of these jobs involve high-skill construction occupations, the jobs created will provide good wages and training opportunities for local residents and promote economic benefits to affected communities.
This investment into cleaning up our nation’s water supply also would generate $38.3 billion in labor income, $11.7 billion in taxes, and $53.9 billion in additional value to the economy. That would represent a 120 percent return on investment.
In addition to the jobs created and value added to the economy from this activity, additional benefits like increased positive health outcomes would be generated. It has been estimated that an additional $22,000 of societal benefits are generated for every lead pipe replaced as a result of lower cardiovascular disease. Since in many areas lead service lines are more likely to exist in environmental justice communities, and since Black and Latino children have disproportionately high overall lead exposure, replacing these lead pipes will also greatly benefit low-income and minority households.
The scope of this work is massive and reaches every state. The Natural Resources Defense Council (NRDC) estimates that between 9.7 million to more than 12 million lead service lines are distributing water throughout our nation. About 700,000 or more of these service lines are found in Illinois, while Ohio, Michigan, New York, New Jersey Missouri and Wisconsin each contain more than 300,000 of the nation’s lead service lines; the top ten states total about 4 million.
Findings
560,800 total job-years*
$104 billion: total economic activity generated
10 million lead service lines that need to be replaced
* 56,080 jobs annually over ten years
** Includes $38.3B in labor income, $11.7B in taxes and $53.9B in additional economic benefits
Methodology
BW Research used IMPLAN to conduct the economic impact analysis, resulting in the jobs, value-added, labor income, and taxes data. IMPLAN is an input-output modeling software that tracks spending patterns through the economy and their resulting impacts on economic indicators. The cumulative effects of the initial investment are quantified, and the results are categorized into direct, indirect, and induced effects. To capture interstate flows, direct and indirect impacts are results of national-level multipliers, distributed across states using state-level modeling. Induced impacts are the results of state-level multipliers, so as not to overestimate the impacts of household spending. Workforce data such as occupational demographics and wages are derived from JobsEQ by Chmura. JobsEQ is a workforce data software that derives data from Bureau of Labor Statistics and Census Bureau data, among other sources. Unionization rates are derived from unionstats.com.
Direct Impacts show the initial change in the economy associated with the investment. For example, pipefitters installing new service pipes or engineers planning the replacement.
Indirect Impacts include the supply chain responses as a result of the initial investment (i.e., water pipe manufacturers).
Induced Impacts refer to household spending and are the result of workers who are responsible for the direct and indirect effects spending their wages (i.e., direct and indirect workers spend income on clothes, food, healthcare, etc.).
Labor Income includes all forms of employment income, such as employee compensation (wages and benefits) and proprietor income (i.e. payments received by self-employed individuals and unincorporated business owners). Labor income is a component of value added.
Value Added is defined as the total value of production after netting out intermediate goods. This is another term for GDP.
About this Report
This economic impact analysis was conducted by BW Research Partnership for E2 in partnership with the United Association of Union Plumbers and Pipefitters. It uses the Biden Administration’s stated goal of 100 percent removal of lead service lines (LSLs) from America’s drinking water systems, the Natural Resources Defense Council’s (NRDC) national survey of LSLs, and the Environmental Protection Agency’s (EPA) estimated LSL replacement costs.
Special thanks to NRDC and BW Research. For a description of the methodology used in this report, please refer to the explanation on page in Appendix A.
Please review this E2 action alert letter and add your e-signature by using the fields below and clicking the ADD YOUR SIGNATURE button. Note that your are signing on as an individual and not as a representative of your employer.
The E2 & 1 Hotels the fellowship program is designed to help early career environmentally-minded entrepreneurs and community leaders to create and implement unique projects at the intersection of the economy and environment. This year’s projects span a wide...
The EPA officially revoked the endangerment finding for greenhouse gas (GHG) emissions and eliminated clean vehicle standards in a blow to both our economy and our environment.
Businesses abandoned $5.1 billion in large-scale factories and clean energy projects in December, capping a turbulent year for the sector that saw nearly $35 billion in investments disappear along with more than 38,000 current and future jobs, according to ...
February 4 2026
Donate Today
Make a donation to help E2 advance policies that are good for the economy and good for the environment. Your donation is 100% tax-deductible from our partner, the NRDC.
Please contact E2 Membership Director Ying Li at [email protected] or 212-727-4437 for stock and wire transfer instructions.
For stocks, alert us to the transfer and provide the name of the stock and the number of shares being donated. This will help us track your donation internally and enable NRDC to provide an accurate gift receipt in a timely fashion.
Donations to E2 go directly to NRDC, a 501(c)3, and are fully tax-deductible (Federal Tax ID: 13-2654926). E2 collects no funds. NRDC provides full-time staffing dedicated to E2, as well as administrative, communications, legislative and analyst/policy support for the work of E2.
By Check
Make personal, Foundation or Donor Advised Fund checks payable to NRDC (indicate your donation is for E2 Membership to expedite processing) and send to:
Natural Resources Defense Council
Attn: Gift Processing
40 West 20th Street, 11th floor
New York, NY 10011