Clean Jobs Colorado 2022

Date: February 1, 2022

Summary:

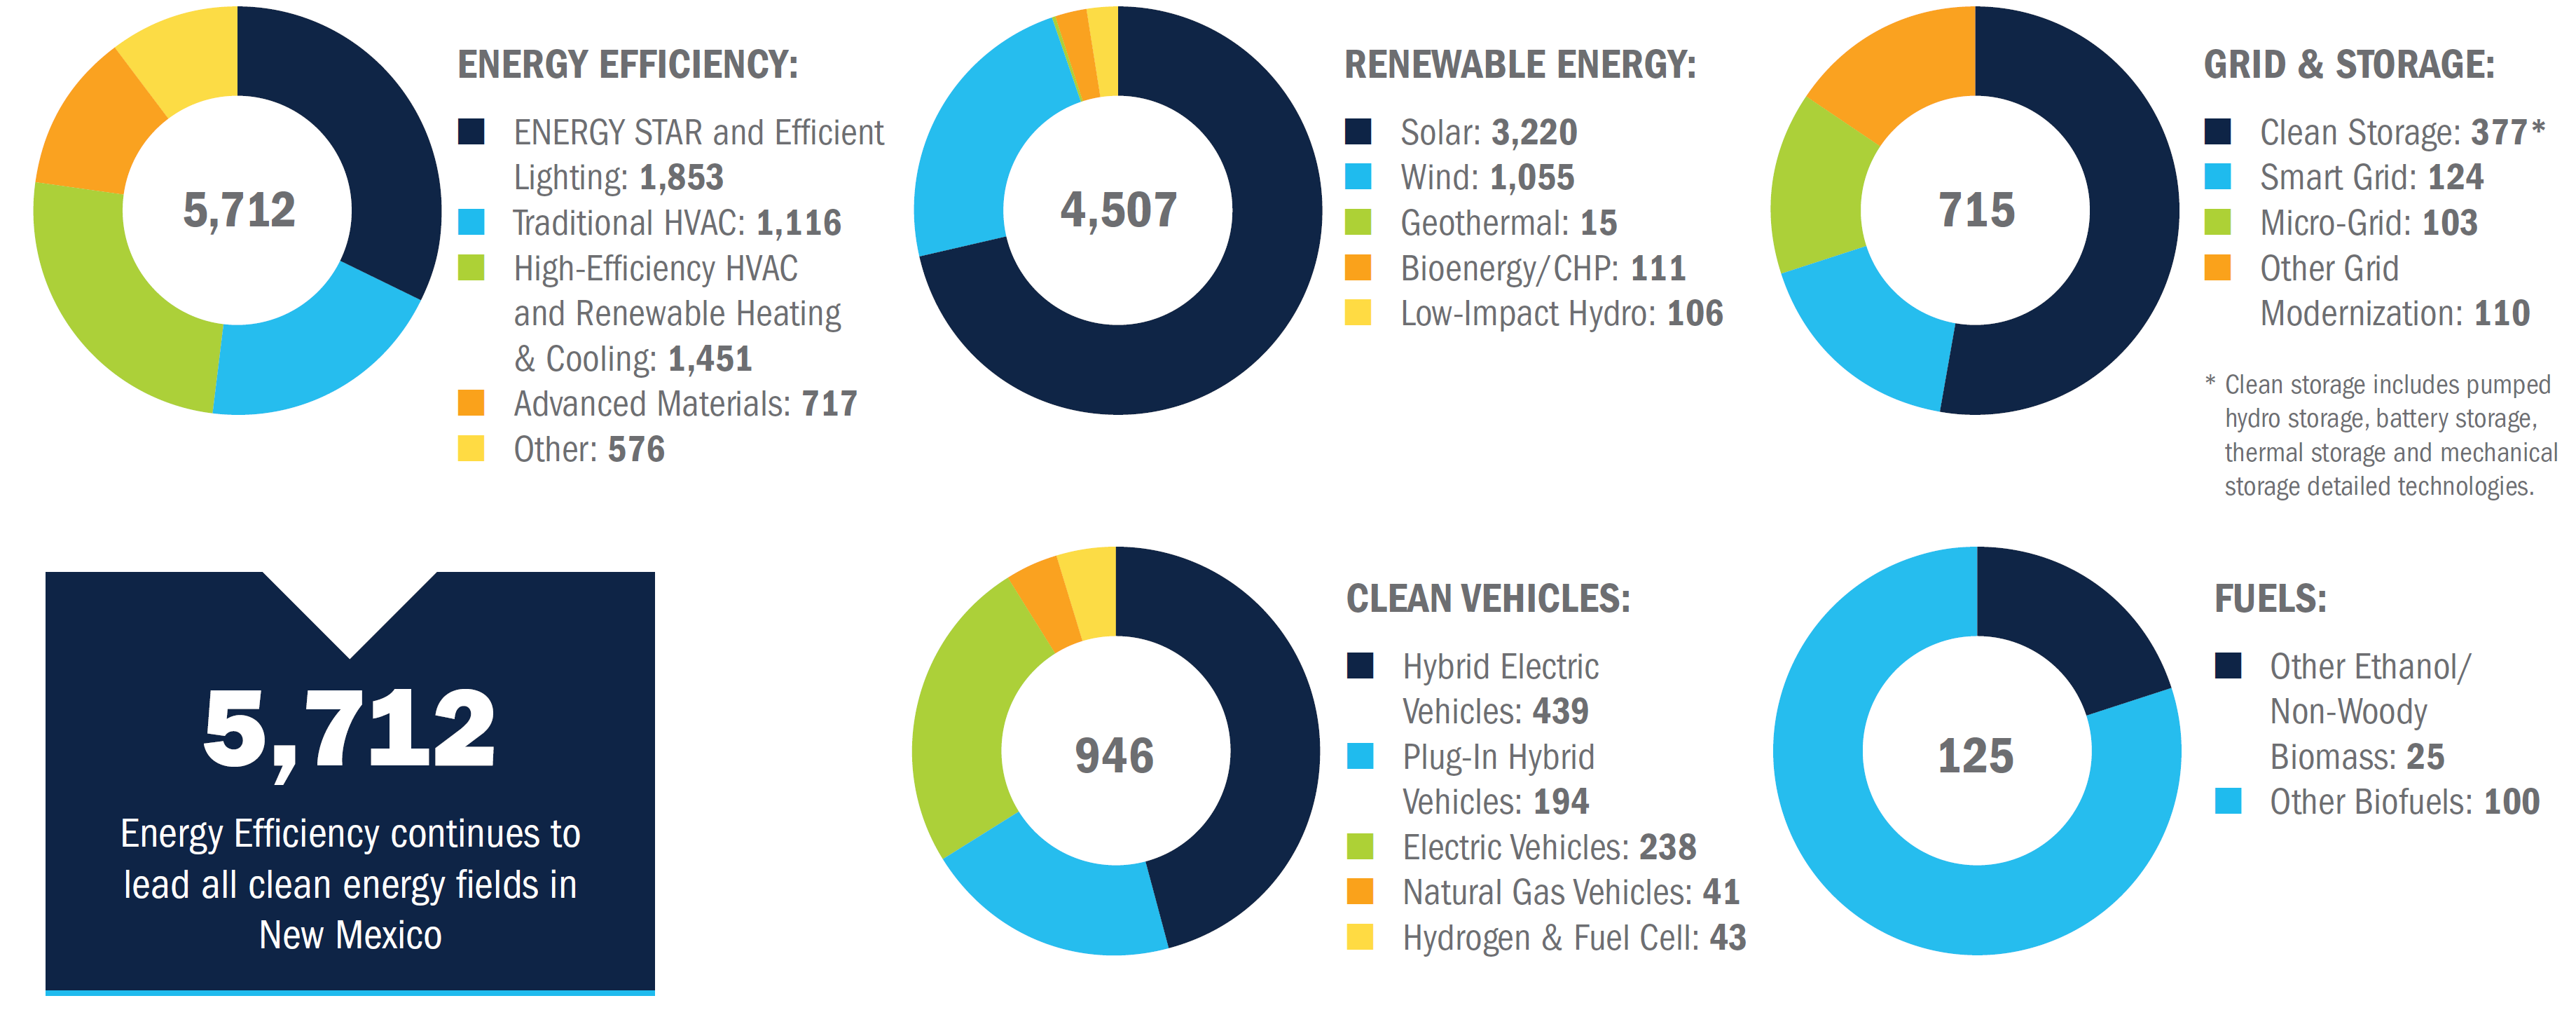
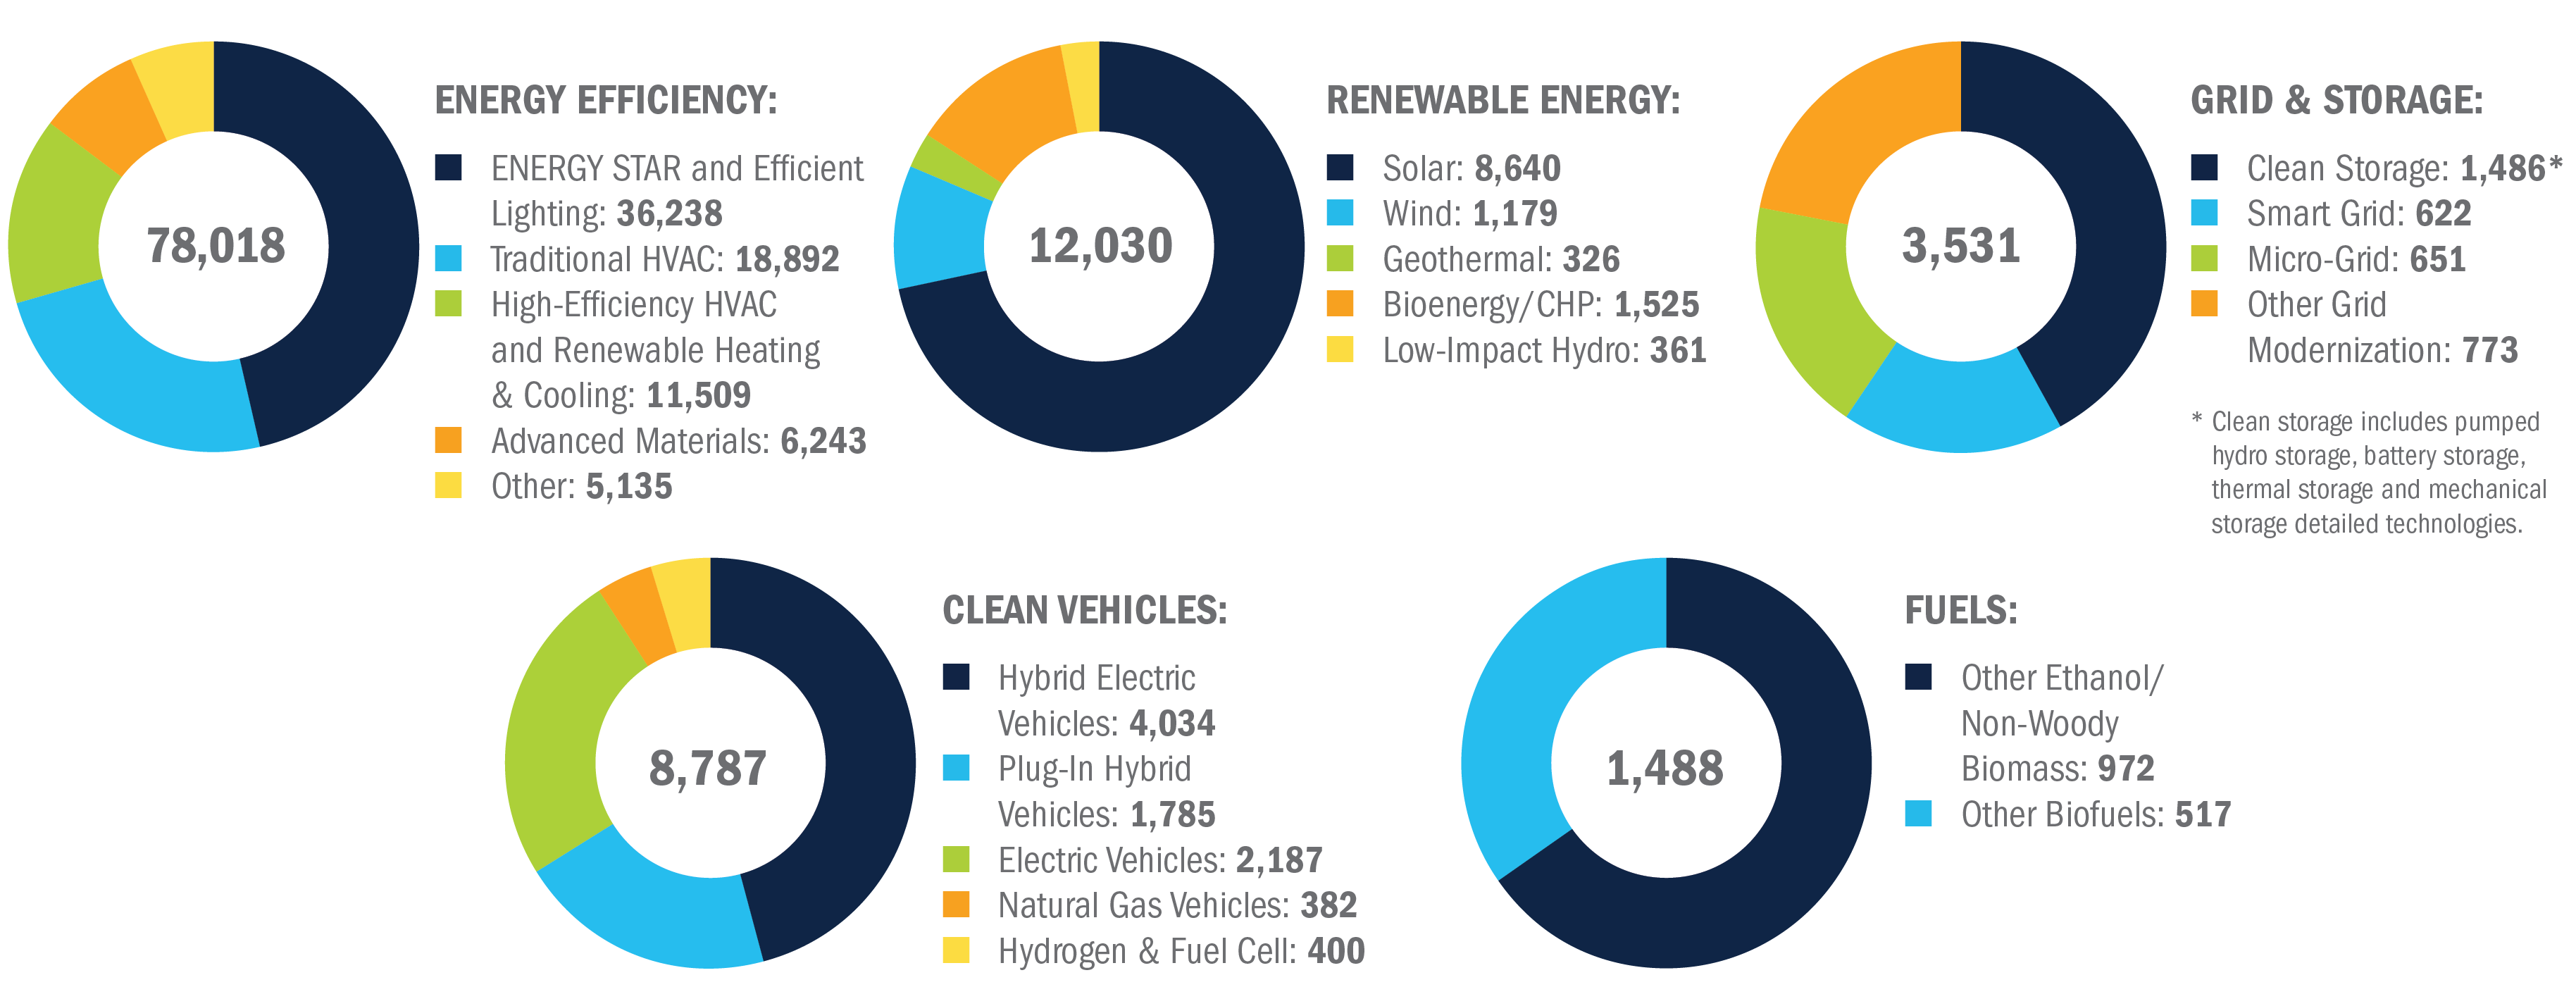
Colorado’s clean energy sector employed 61,179 workers by the end of 2021 — an increase of 5.2 percent. The energy efficiency sector continued to lead the field, accounting for 56 percent of all state clean energy jobs, followed by renewable energy and clean vehicles.

This field is for validation purposes and should be left unchanged.

Other Key Findings

  • 1 in 10 construction jobs in Colorado are in clean energy
  • 27% growth in clean vehicles led all clean energy sectors
  • 42% of all energy industry jobs in Colorado are in clean energy
  • Small businesses (<20 employees) accounted for about 2 out of every 3 clean energy jobs

Colorado Clean Energy Employment, 2021

Energy Efficiency 34,205
Renewables 17,625
Clean Vehicles 4,318
Storage and Grid 3,044
Clean Fuels 1,987
TOTAL 61,179

Policies Matter

Colorado continues to be a leader in the Mountain States in clean energy jobs, in a large part due to the successes in adopting clean energy policies year after year. The 2022 legislative session was no exception. Our priority legislation addressed air quality, wildfire response, equity, and the clean economy.3

With a unanimous decision, the Colorado Public Utilities Commission (PUC) recently approved Xcel Energy’s plan to retire the Comanche 3 coal power plant in Pueblo, Colorado, no later than January 1, 2031, bringing an end to coal in the state. This agreement, supported by stakeholders, ensures a just transition that is fair to workers and the community.4

Despite this progress, a recent state official report shows Colorado is behind in achieving its legislated goals of 26 percent cuts of greenhouse gas emissions from 2005 levels by 2025.5 Colorado lawmakers need to adopt ambitious policies in all sectors to bring down emissions and increase opportunity to save money and develop new jobs in the clean economy.

Previous Reports

Clean Jobs Colorado 2022 is the 6th clean energy jobs report for Colorado from E2. Previous reports can be accessed in the below links.

Background

This is the sixth annual Clean Jobs Colorado report produced by E2 based on analysis of the USEER, which was first released by the DOE in 2016. E2 was an original proponent of the DOE producing the USEER and was a partner on the reports produced by the Energy Futures Initiative (EFI) and National Association of State Energy Officials (NASEO) after the Trump administration abandoned it in 2017.

For additional insight into E2’s Clean Jobs Colorado or our other annual clean energy economic reports, visit e2.org/reports.

An FAQ is available at e2.org/reports/clean-jobs-america-faq.

View Report »

Clean Economy Works February 2023 | 21 New Projects Announced

Date: March 8, 2023

FOCUS: New battery projects creating jobs, solutions

It’s a common question when it comes to any discussion about electric vehicles (EVs): What to do with the old batteries?

One huge solution is now on the way.

In February, the Department of Energy Loan Programs Office announced a $2 billion loan to Redwood Materials to build and expand a factory in Nevada that will recycle materials in spent lithium-ion batteries and recover anode and cathode materials that can be used to build new batteries. The funding was made possible by the Inflation Reduction Act (IRA).

The massive Nevada project is expected to create approximately 3,400 construction jobs and 1,600 full-time jobs once the plant is up and running. It’s one of the latest major announcements in what’s shaping up to be a very busy year across the country for clean energy.

To help stay on top of major projects like these – as well as smaller ones that could slip through the cracks –E2 is launching Clean Economy Works, a rundown delivered to your inbox near the beginning of each month of clean energy project announcements made possible in part due to the IRA and other recently enacted federal policies.

E2 has long expertise in this space: We’ve been closely tracking clean energy jobs and project announcements for more than a decade, and we know there’s never been a more crucial time to know what’s happening than now.

And what’s happening now is that battery projects are popping up everywhere.

A rendering of Redwood Materials’ expanded Nevada EV battery material manufacturing facility. Redwood Materials

Redwood’s Nevada factory is one of numerous battery-related projects announced in February that stem from federal policies, investments and tax credits.

In Michigan, Ford Motor Co. announced plans for a $2.5 billion electric vehicle battery factory that will create an estimated 2,500 jobs. In Wisconsin, WEC Energy Group announced plans in February for a $200 million long-duration energy storage facility in Milwaukee.

These projects are making America more competitive on the global marketplace – something that’s been desperately missing in some sectors. Currently, Asian countries led by China, Korea and Japan account for about 92 percent of the global market share for EV batteries. And of the 304 gigafactories being developed prior to IRA passing, just 23 were in North America.

Last month was a big step forward, but America will need many more as countries everywhere accelerate their own transition timetables. Millions of jobs and trillions in investments are up for grabs in the coming decade.

Want to stay on top of these announcements? Know someone who does? Please forward this to them and/or drop us a note at [email protected].

Quotable

“We can’t control the wind. We can’t control the sun. We know it’s going to be there most of the time. But when it’s not, we need to make sure that we can keep the lights on. And batteries are so great to continue and expand that clean energy.”

Brendan Conway, WEC Energy Group

“This investment will continue to bring the supply chain of electric vehicle batteries home to Michigan and make sure that production lines aren’t stalled by global shocks or shipping delays. We’re going to make electric vehicles top to bottom right here in the great state of Michigan.”

Michigan Gov. Gretchen Whitmer (D)

“It doesn’t pollute; it is the cheapest energy source. The technology we use is American-made.”

Dominika Sink, director of development, Energix

“As America’s most diverse industrial manufacturer of steel products, we will be able to efficiently supply this new plant, helping to ensure that our nation’s critical energy and digital infrastructure is built with the cleanest, most sustainable steel in the world.”

Leon Topalian, CEO, Nucor Corp.

“As we work to ensure our state is the e-mobility capital of the nation, projects like this will continue to choose the No. 1 state for business and benefit communities in just about every zip code of Georgia.”

Georgia Gov. Brian Kemp (R)

“Hyundai’s new EV facility is drawing an experienced and dedicated supplier network to the [Savannah] region, adding to [Georgia’s] industry expertise and shaping a larger skilled workforce.”

Pat Wilson, Commissioner, Georgia Dept. of Economic Development

Opportunities

Bipartisan Infrastructure Law: Funding opportunities you can apply for today

“… [T]here is billions more in funding available today through competitive programs. … This document highlights funding opportunities that communities can apply for today, along with a calendar for funding opportunities across 2023.” Read more

EPA announces initial program design of Greenhouse Gas Reduction Fund

“… [O]utlin[es] key parameters of the grant competitions that will ultimately award nearly $27 billion to leverage private capital for clean energy and clean air investments across the country.” Read more

Biden-Harris Administration announces historic investments to support America’s energy and industrial communities

“… [S]everal major programs to accelerate domestic clean energy manufacturing and ensure traditionally underserved communities benefit from clean energy technologies.” Read more

Floating Offshore Wind Shot

“… [A]n initiative to help usher in a clean energy future by driving U.S. leadership in floating offshore wind design, development, and manufacturing. … [S]eeks to reduce the cost of floating offshore wind energy by at least 70 percent, to $45 per megawatt-hour by 2035 for deep sites far from shore.” Read more

DOE announces $23 million to fund onsite energy Technical Assistance Partnerships to drive industrial decarbonization

“… [A] $23 million funding opportunity that will establish a regional network of TAPs to help industrial facilities and other large energy users increase the adoption of onsite energy technologies.” Read more

DOE’s American-Made Challenges: Perovskite Startup Prize

“… [A] two-stage, $3 million prize competition designed to accelerate the development and manufacturing of perovskite solar cells by moving world-class research out of the lab and into new U.S. companies. … The final cycle of the Countdown Contest opened in November and will close on March 23.” Read more


Funding Notice: Enhanced Geothermal Systems Pilot Demonstrations

“… [U]p to $74 million to support EGS pilot demonstration projects called for in President Biden’s landmark Bipartisan Infrastructure Law. The legislation authorizes DOE to support up to seven competitively selected pilot projects…” (Hurry! Intent letters due March 8) Read more

Advanced Energy Manufacturing and Recycling Grants

“… [D]esigned to provide grants to small- and medium-sized manufacturers to enable them to build new or retrofit existing manufacturing and industrial facilities to produce or recycle advanced energy products in communities where coal mines or coal power plants have closed.” Read more

American-Made Net Load Forecasting Prize

“… designed to increase adoption of the state-of-the-art in net load forecasting. … [O]pen to forecasting industry organizations that cater to utilities, system operators, and power plant owners, as well as academic teams with machine learning capabilities that are interested in forecasting. … This prize offers up to $600,000 in cash prizes, with three anticipated winners and three anticipated runners-up.” Read more

February Clean Economy Announcements

In February, E2 tracked 21 projects across 15 states that will bring $7.5 billion in investments and create at least 9,528 jobs.

DATE COMPANY/ORG STATE ANNOUNCEMENT SECTOR DETAILS
2/1 Seoyon E-HWA GA Link EVs 740 Jobs
$76M
2/1 Piney River Solar LLC VA Link Solar Gen. 200 Jobs
50MW
2/3 Alliant Energy WI Link Energy Storage $200M
99 MW
2/7 Kempower NC Link EVs 601 Jobs
$41.2M
2/8 MSS Steel Tubes USA TN Link Solar Mfg. 129 Jobs
$6M
2/9 Redwood Materials NV Link Battery/Storage Mfg. 1600 Jobs
$2B
2/9 Pallidus SC Link Battery/Storage Mfg. 405 Jobs
$443M
2/9 Alpha Steel LLC TX Link Solar Mfg.
2/13 Ford & Contemporary Amperex Technology MS Link Battery/Storage Mfg. 2500 Jobs
$3.5B
35 GWh
2/15 Tritium TN Link Charging/Grid 250 Jobs
2/21 Sewon America GA Link EVs 740 Jobs
$300M
2/21 Duke Energy NC Link EVs
2/22 Ecobat AZ Link Battery/Storage Mfg. 60 Jobs
2/22 Nucor AL Link Charging/Grid 200 Jobs
$125M
2/23 May Renewables LLC SC Link Solar Gen. $70M
100 MW/400 MWh
2/23 Pine Gate Renewal MS Link Solar Gen. 300 Jobs
$115M
40 MW
2/26 Li-Cycle NY Link EVs 1270 Jobs
$375 Million
2/27 Dongwha Elecrolyte USA TN Link Battery/Storage Mfg. 68 Jobs
$75M
2/28 Stellantis IN Link EVs 265 Jobs
$155M
2/28 Nyle Systems ME Link Energy Efficiency 200 Jobs
$6M
2/28 Nel ASA CT Link Fuel-Cells/Hydrogen $24.8M

About Clean Economy Works Analysis

This analysis uses only publicly available information from announced funding and plans for clean energy projects, expansions, and renewed production. Projects that began development, were proposed, or applied for local and state approval before the passage of the Inflation Reduction Act in August of 2022 are not included.

View Report »

California’s Offshore Wind Opportunity

Date: February 27, 2023

Creating jobs in CA by developing a new clean energy resource

Summary:

As the Biden administration steps up efforts to expand offshore wind resources, this report finds that development of floating offshore wind in the waters off of Morro Bay and Humboldt Bay in California could create and support nearly 175,000 jobs, add $45 billion to the state’s economy, and produce 4.6 GW of wind energy.

California and federal lawmakers have an opportunity to hasten development—and scale the deployment—of this valuable new technology by enacting appropriate policies now. This is especially urgent on the heels of President Joe Biden signing into law the Inflation Reduction Act (IRA) of 2022. This bill includes full-value tax incentives for the manufacturing and deployment of technologies like offshore wind in the U.S. The IRA also includes billions of dollars for the U.S. Department of Energy (DOE) to help scale up technologies like floating offshore wind.

Offshore wind will diversify California’s renewable energy supply. This is critical to a stable electric grid and, crucially, can help the state achieve its long-term clean energy and climate ambitions in a least-cost manner. At the same time, floating offshore wind can create tens of thousands of new jobs for Californians, benefit underserved communities, and generate billions of dollars’ worth of wages, investments, economic benefits and tax revenues at the state, local and federal levels.

This field is for validation purposes and should be left unchanged.

Policy Matters

California has been a global climate leader by passing policies that have created the market structures necessary to drive innovation, build the state’s clean energy economy and reduce carbon emissions. To maximize the economic benefits of harnessing the state’s offshore wind resources—especially in light of the major federal clean energy investments in the Inflation Reduction Act—state and federal governments must advance policies that will drive a sustainable, resilient offshore wind industry in California. Specifically, this includes:

// Development of a strategic plan by the end of 2023 that formalizes targets; identifies suitable sea space, programs and funding; advances economic and workforce development and in-state manufacturing opportunities; optimizes transmission planning and permitting; identifies potential impacts on ocean uses and the environment, as well as strategies for addressing those potential impacts; and helps de-risk projects early on in order to provide greater certainty for the industry.

// Ensuring that AB 525 requires the CEC to develop a permitting road-map that describes timeframes and milestones for a permitting process for offshore wind energy facilities and associated electricity and transmission infrastructure off the coast of California.

// The State of California must investigate the need for—and, if warranted, approve construction of—a subsea transmission cable from the Los Angeles Basin to Diablo Canyon. This could resolve current regional transmission constraints, reduce dependency on dirty natural gas peaker plants, and minimize threats of grid-induced wildfire, while providing transmission capacity to connect Southern California with potential future offshore wind development.

// State officials must leverage funding from the Infrastructure Investment and Jobs Act dedicated for grid modernization to upgrade the grid for offshore wind energy integration.

// Congress must invest more in grid modernization including passing a grid modernization tax credit that is essential to the development of offshore wind and the deployment of utility scale clean energy generally.

// The CEC, in partnership with the Ocean Protection Council and BOEM, must make continued investments in environmental planning and mapping for offshore wind development, primarily through the funding and support of the Offshore Wind Data Basin.

// The State should develop and fund an institute—under the purview of the California Coastal Commission—dedicated to the collecting and public sharing of data related to the monitoring and mitigation of ocean ecosystem impacts.

// BOEM must incorporate ocean ecosystem impact monitoring and mitigation stipulations in its lease agreements.

About this Report

The research team estimated local economic impacts for the Morro Bay and Humboldt Bay offshore wind projects using NREL’s modeling tool Jobs and Economic Development Impact (JEDI). JEDI is an input-output modeling tool used to generate outputs for employment, Gross Regional Product (GRP) and earnings for the construction and operations of a particular offshore wind project. The model illustrates the interdependent relationships between the different sectors of a region’s economy, to produce employment figures that vary according to the modeled project’s energy output and local content. The offshore wind activities modeled for the two locations are used as inputs into the model to estimate the multiplier effect on business, household, and government expenditures and industry employment. JEDI estimates these effects based on facility size, energy output, year of construction and the built-in economic multipliers specific to the project location. The economic outputs outlined in this report include:

// Jobs created from the construction of offshore wind facilities with 1.8 GW of capacity in Morro Bay and 1.2 GW in Humboldt Bay by 2030, a total of 3 GW in capacity across both sites.

// Jobs created from the construction of 4.2 GW of additional capacity in Morro Bay and 2.8 GW in Humboldt Bay between 2030 and 2040, to reach a total of 10 GW of offshore wind capacity across both sites.

// Annual number of jobs created for the operation of the initial 3 GW installed by 2030.

// Annual number of jobs created for the operation of 10 GW installed by 2040.

// Employment split by industry for Construction and Operations phases.

// Labor income resulting from jobs created by offshore wind projects.

// Additional GRP for Morro Bay and Humboldt Bay because of economic activity from offshore wind projects.

// Local, state, and federal tax revenue for Phases 1 and 2.

For questions on this report, methodology, reported job numbers, or requests for specific additional data, email E2 Communications Director Michael Timberlake ([email protected]).

View Report »

Clean Jobs New Mexico 2022

Date: February 22, 2023

Summary:

New Mexico’s clean energy sector employed 12,014 workers by the end of 2021 an of 8.1% from 2021, the highest rate of job growth in the country. This strong growth was mainly driven by increase in clean fuels and clean vehicle jobs.

This field is for validation purposes and should be left unchanged.

Other Key Findings

  • 8.1% – New Mexico led the nation in clean energy job growth in 2021.
  • 56% – Small businesses (<20 employees) accounted for nearly 3 out of every 5 clean energy jobs in New Mexico.
  • Most Diverse New Mexico continues to have the most diverse clean energy workforce in the U.S. Hispanic and/or Latinos account for more than 1 in 5 workers (22.6%) and multiracial workers make up more than 1 in 7 (14.0%).
  • 11.7% – Clean energy job wages are above state-specific medium wage.

Figure 4 // U.S. Clean Energy Employment by subsector 2021

Policies Matter

As evidence by the massive wildfires in New Mexico this year, the state needs to improve resilience and speed up the transition to a clean, sustainable economy. Policies need to focus on achieving New Mexico’s goal to reduce statewide greenhouse gas emissions at least 50 percent by 2030 as compared to 2005 levels.4 Lawmakers and state agencies need to adopt ambitious policies in all sectors, framed by equity principles, to bring down emissions and increase opportunity to save money, develop new jobs, and secure a healthy, clean energy economy.

Some of our top policy priorities for 2023 in New Mexico are:

// Accelerate the transition to 100% clean electric generation, which is required in the state by 2045 for most utilities. The state should move faster by requiring utilities to reach 90 percent emissions reductions by 2030 and aim for 100 percent by 2035.

// Ensure New Mexicans have access to the increasing numbers of clean electric cars and trucks by adopting Advanced Clean Truck and Clean Cars II rules.

// Provide EV tax credits for low-income families.

// Build out more electric vehicle charging stations, deliver free, expanded and zero-carbon electric transit options, and pedestrian and bike safety infrastructure.

// Expand low-income building weatherization and electrification funding through Community Energy Efficiency Development block grants and other programs.6

// Invest in state partnerships and tax incentives to bring zero carbon industries to the state, supporting both manufacturing components of the clean energy transition (electric cars, batteries, solar panels, wind turbines, etc.) and industries that can utilize New Mexico’s immense renewable energy potential.

The state must also leverage federal funding made available through the Bipartisan Infrastructure Law and the Inflation Reduction Act. New Mexico can invest in the infrastructure needed to drive greater deployment of electric vehicles, renewable energy projects, and other clean energy solutions, with an emphasis on investments in disadvantaged communities.

Previous Clean Jobs New Mexico Reports

View Report »

26 New Clean Energy Projects Announced in Jan., At Least 105 Since IRA Passed

CA, GA, NY, and TX led with most announcements U.S. businesses announced funding and plans for at least 26 clean energy projects, expansions, and renewed production across at least 16 states in January, according to a new monthly review from the national nonpartisan business group E2 (Environmental Entrepreneurs). Developments range from new electric vehicle (EV) […]

Building Opportunity: Chicago

Date: January 25, 2023

The Economic Benefits of Advancing Clean Building Policies in the Windy City

Summary

Chicago is home to more than 12,000 workers engaged in work directly related to making Chicago’s building sector cleaner and more efficient. This workforce includes workers who replace old insulation in the attics of single-family homes, fit new pipes for geothermal heating and cooling systems in commercial buildings, and install electric stoves and air source heat pumps in homes and buildings.

To better understand how electrifying and making Chicago’s buildings more energy efficient would impact the city’s labor market, E2 took a deeper dive into Chicago’s overall clean buildings employment data.

Building Decarbonization and Electrification Employment by Value Chain, 2021

Professional Services 5,769
Construction 4,459
Manufacturing 1,726
Wholesale Trade 664
Other Services 104
Total 12,722

Policies Matter

Policies that support electrifying and making Chicago’s buildings more energy efficient can create job opportunities and result in substantial economic and climate benefits for Chicago residents. With the Inflation Reduction Act incentives creating an unprecedented opportunity for cities, states, and customers to advance clean energy and building retrofits, the time to act is now. The City of Chicago must pass the following by early 2023:

  • Carbon Emissions Standard for New Construction: Adopt the proposed Clean Buildings, Clean Air ordinance that sets a carbon emissions standard to prohibit fossil fuel powered appliances in new commercial and residential construction and gut renovations of existing buildings. The ordinance phases in requirements starting with lower-rise buildings in mid-2024 and for taller buildings by end of 2024 and includes exceptions for select uses like industrial processes, hospitals, and commercial cooking.

DOWNLOAD

Download the complete report at at this link.

BACKGROUND

This analysis of the United States Energy and Employment Report (USEER) was produced by BW Research for E2. The USEER survey includes workers who spend a plurality of their time working to improve the energy efficiency of a building, factory, residence, etc., without regard to the type of energy source used—including those workers who may still may still be installing high-efficiency gas technologies. As buildings transition from gas to all-electric these jobs will transition with them, as the skills required for both technologies are highly transferable.

View Report »

Energy Efficiency Jobs In America 2022

Date: January 25, 2023

A STRONGER U.S. ENERGY EFFICIENCY WORKFORCE

Summary

Nearly 2.2 million Americans now work in energy efficiency —more than any other sector of the U.S. energy industry, including oil, gas and coal (but not motor vehicles) — according to the newest Energy Efficiency Jobs in America from E4TheFuture and E2 (Environmental Entrepreneurs).

Despite growing more slowly than the energy industry overall, energy efficiency businesses added nearly 60,000 jobs in 2021 – accounting for almost half of the 132,000 jobs the overall sector added in 2021. California and Texas claimed the most total energy efficiency jobs again with nearly 450,000 jobs between the two states alone, while Nevada (7 percent), New Mexico (7 percent), Oklahoma (5.3 percent), New Jersey (5.2 percent), and Colorado (5 percent) led the country in year-over-year job growth.

Among the key local findings are that nearly 290,000 Americans living in rural areas work in energy efficiency with more than 40 percent of all workers living outside of America’s top 50 metro areas.

Energy efficiency saves money, reduces emissions, improves air quality and public health, and makes us more energy independent—while also tackling climate change and creating jobs. The Inflation Reduction Act (IRA) and the Infrastructure Investment and Jobs Act (IIJA) included historic investments aimed at advancing energy efficiency across the country. The effective implementation of the energy efficiency provisions in IRA and IIJA, and the continued funding for government-led energy efficiency activities, are both crucial to realizing the benefits of this critical energy source

Download

To download the national summary, click here or the report cover above.

For all 51 individual factsheets, visit https://ee.e4thefuture.org/ .

Previous Reports

QUESTIONS & FAQ

For questions on this report, methodology, reported job numbers, or requests for specific additional data, email E2 Communications Director Michael Timberlake ([email protected]). An FAQ for the report, including answers to questions on methodology, is available here.

View Report »

Building Opportunity: New Jersey

Date: December 5, 2022

The Jobs and Economic Benefits of Decarbonizing
Buildings Across the Garden State

SUMMARY

The Garden State is home to nearly 33,000 people who are employed in work directly related to constructing high-performance, climate-friendly, decarbonized buildings capable of running on 100% clean power. The work they engage in includes activities like installing electric induction stoves in kitchens in Hoboken, replacing old insulation in drafty attics of single-family homes in Hunterdon County, or fitting new pipes for geothermal heating and cooling systems in offices in industrial parks along the Jersey Shore.

To better understand how decarbonizing New Jersey’s buildings is impacting the state’s labor market, E2 took a deeper dive into the state’s overall building decarbonization employment data.

By looking at five employment areas — technology; value chain; residential and commercial sector employment; electrification, building envelope and other energy efficiency; and specific occupational analysis —we found that:

  • Northern New Jersey is home to the highest concentration of the state’s building decarbonization jobs but every other region in the state is home to thousands as well.
  • More than half of New Jersey’s building decarbonization jobs were in construction-related fields, which can include tasks like erecting scaffolding and other temporary construction site structures, loading or unloading building materials, operating on-site equipment, and digging trenches and earthworks to prepare construction sites.
  • Statewide, there are more than 21,000 workers involved in residential building decarbonization; another 16,000 work in commercial building decarbonization, with some overlap between the two. This suggests broad opportunities and transferable skills for people who work on everything from single-story ranch houses and barns, to high-rise office buildings in urban centers.
  • In 2020, the average annual wages for five select occupations within building decarbonization in New Jersey ranged from $56,700 (for workers who are involved in insulation, floors, ceilings and walls) to $75,800 (plumbers, pipefitters and steamfitters). Introduction
  • The education required for entry-level jobs and the on-the-job training that workers receive varies depending on the occupation. This suggests a wide range of opportunities for workers with various experience levels, backgrounds and education.

Job Highlights by Technology, 2020

Technology New Jersey Jobs
Energy Star & Efficient Lighting 7,167
High Efficiency HVAC & Renewable H&C 6,594
Traditional HVAC 10,181
Other 6,505
Advanced Materials & Insulation 2,433
Total 32,880

Wage, Education, and Training Highlights by Occupation, 2020

The wage data shows how significant of an opportunity building decarbonization represents to workers in New Jersey and to the overall economy. In five of the most common building decarbonization occupations, average annual wages in New Jersey range from $56,700 to $75,800.

Occupation New Jersey Avg Annual Wage National Avg. Annual Wage Education & Training: Typical Entry-Level Education Education & Training: Typical On-the-Job Training
Heating, Air Conditioning,
and Refrigeration Mechanics and Installers
$63,500 $54,690 High School diploma or equivalent 2-year degree or certificate; long-term on-the-job training
Electricians $75,100 $63,310 High School diploma or equivalent Apprenticeship; long-term training
Construction Laborers $58,700 $44,130 High School diploma or equivalent Short-term on-the-job-training
Insulation Workers, Floor,
Ceiling, and Wall
$56,700 $44,810 High School diploma or equivalent Short-term on-the-job-training
Plumbers, Pipefitters,
and Steamfitters
$75,800 $62,250 Four-year degree Apprenticeship; short-term on-the-job-training

Demographic Highlights by Race and Ethnicity, 2020

The majority of workers within each occupation in the state are white, followed by Black and Asian. Hispanic or Latino workers make up the majority of insulation workers and construction laborers in New Jersey and are approximately one-fifth of the overall workforce in the state.

Occupation AMERICAN INDIAN OR ALASKAN NATIVE ASIAN BLACK NATIVE HAWAIIAN OR OTHER PACIFIC ISLANDER WHITE* TWO OR MORE RACES HISPANIC OR LATINO** NOT HISPANIC OR LATINO
Heating, Air Conditioning,
and Refrigeration Mechanics and Installers
0.2% 1.8% 13.9% 0.1% 81.8% 2.4% 30.7% 69.3%
Electricians 0.1% 3.7% 11.8% 0.0% 82.4% 1.9% 26.2% 73.8%
Construction Laborers 0.6% 4.1% 13.0% 0.0% 80.0% 2.3% 51.3% 48.7%
Insulation Workers, Floor,
Ceiling, and Wall
0.6% 2.2% 14.6% 0.0% 79.8% 2.8% 52.9% 47.1%
Plumbers, Pipefitters,
and Steamfitters
0.4% 2.2% 12.0% 0.0% 82.5% 2.8% 31.1% 68.9%
NJ Clean Energy Statewide 0.2% 10.7% 14.5% 0.1% 72.2% 2.3% 20.3% 79.7%

DOWNLOAD

Download the complete report at at this link.

BACKGROUND

This is the first Building Opportunity: New Jersey report produced by E2 based on analysis of the USEER, which was first released by the DOE in 2016. E2 was an original proponent of the DOE producing the USEER and was a partner on the reports produced by the Energy Futures Initiative (EFI) and National Association of State Energy Officials (NASEO) after it was abandoned in 2017.

View Report »

Clean Jobs North Carolina 2022

Date: October 19, 2022

Summary:

Clean jobs in North Carolina grew by over 4 percent in 2021, more than double the growth rate of the state’s total workforce for the year. That growth also demonstrates the clean energy economy’s strong recovery from the COVID-19 economic downturn and sets North Carolina up for even more clean energy job opportunities in the years to come — especially with the right policies in place.

This field is for validation purposes and should be left unchanged.

Other Key Findings

  • Black and African-Americans are under-represented by nearly 60% in North Carolina’s clean energy economy. Black workers occupy more than 21% of all jobs in the state, but less than 9% of clean energy jobs.
  • North Carolina was home to 3.2% of the nation’s total clean energy jobs, 9th in the nation.
  • More than two-thirds of the 27,217 clean energy jobs lost in North Carolina during the COVID-19 economic downturn had been regained by the end of 2021.
  • Small businesses (<20 employees) accounted for almost 4 out of every 5 clean energy jobs in North Carolina, ranking 2nd among all 50 states.
  • North Carolina ranked 1st among all 50 states in rural clean energy jobs, with 25,563 clean energy jobs in rural areas.

Figure 4 // U.S. Clean Energy Employment by subsector 2021

Figure 1 // Clean Energy Employment by year 2017–2021

Figure 3 //Clean Energy Employment by value chain 2021

Policies Matter

North Carolina has long been a regional leader in clean energy jobs. That distinction is due in large part to its early adoption of smart clean energy policies like the Renewable Energy and Energy Efficiency Portfolio Standard, which passed the North Carolina General Assembly with bipartisan support back in 2007.

But as other states in the Southeast and throughout the country continue to pass policies that will drive growth in their clean energy economies, North Carolina must build on past successes to maintain its leadership status. The bipartisan passage of the Energy Solutions Act (HB 951) in 2021 was a huge step in the right direction, kicking off much-needed utility reform and establishing ambitious carbon pollution reduction targets for the power sector—70 percent by 2030 and carbon neutrality by 2050.

Now, North Carolina’s policymakers need to implement HB 951 as intended and pass additional policies that send a clear, long-term signal that the state is committed to a clean energy future. In turn, that will empower clean energy companies in North Carolina to continue to invest and grow jobs in the state.

View Report »

REPORT: Midwest Clean Energy Jobs Grew 5% in 2021, Now Home to 714,323 Workers

Midwest’s clean energy economy positioned for even greater growth with Inflation Reduction Act investments Chicago, IL – Clean energy businesses in the Midwest added more than 36,400 workers in 2021, now employing 714,323 Midwesterners across the region. That’s according to a new analysis of employment data released today by the national, nonpartisan business group E2 […]

Billion Dollar Losses, Trillion Dollar Threats: The Cost of Climate Change

Date: October 19, 2022

Summary:

Billion Dollar Losses, Trillion Dollar Threats: The Cost of Climate Change reviews the escalating toll of billion-dollar disasters over the last forty years and provides insight into how these disasters—from hurricanes and flooding to wildfires—are compounded by other extreme weather events, such as record-breaking drought, heat waves, and rainfall.

The trends identified in the report are concerning for America’s economy. Every state in the country has been impacted and faces risks from rapidly escalating  weather and climate disaster damages, with a third of all losses since 1980 occurring in the last five years. From 2017-2021, America experienced its four most expensive wildfires, two of its three most expensive hurricanes, and its most expensive winter storm with economic losses from all disasters totaling $765 billion.

This field is for validation purposes and should be left unchanged.

Findings

Billion-dollar weather and climate disasters in the form of hurricanes, severe storms, drought, flooding, wildfires, winter storms, and freezing have led to $2.2 trillion in losses since 1980 (see Figure 1) (NOAA, 2022). Across the United States, climate change is exacerbating extreme weather events and severely damaging infrastructure, buildings, roads, and cropland. Annual losses from billion-dollar disasters during the last five years—totalling $765 billion in losses and more than 4,500 deaths from 2017 to 2021—were nearly eight times higher than in the 1980s (NOAA, 2022). While billion-dollar disasters are responsible for an estimated 80 percent of total disaster-related losses, the combination of smaller disasters, heat waves, and ongoing business disruptions that are not captured mean the overall economic turmoil is even greater than this analysis details.

Climate change is not the sole driver of natural disasters, but it contributes to their frequency and severity. The world has warmed nearly 1.1 ˚C since 1880 (NASA, 2022), and warming is likely to exceed 1.5 ˚C in the near term, even with significant efforts to curb greenhouse gas emissions (Pörtner, 2022). Each year from 2001 through 2021 were among the 22 hottest years on record (NASA, 2022), and record-breaking temperatures led to a new high of 130 ˚F in Death Valley in 2021.1 These extreme weather events have widespread impacts: a recent analysis from the Washington Post estimated that in 2021 alone, a federal disaster emergency was declared in the home county of more than 40 percent of Americans (Kaplan et al., 2022).

The frequency of climate-related disasters are rising, too. Between 2017 and 2021, the United States experienced its four most-expensive wildfires, two of its three most expensive hurricanes, and its most expensive winter storm (NOAA, 2022). The percentage of state’s total historic weather and climate disaster losses that occurred in the last 5 years is shown in Figure 3.

Figure 1 // Billion-dollar disasters across the U.S. are growing in number and severity

(data source: NOAA, 2022).

Figure 3 // Percentage of state’s total historic losses from weather and climate disasters in last 5 years (total losses shown in text)

(data source: NOAA, 2022).

Figure 2 // Billion-dollar climate- and weather-related disasters accounted for 80 percent of disaster-related losses, totaling $2.2 trillion from 1980-2021 (shown in $billions below).

(data source: NOAA, 2022).

About this Report

This report reviews the historic and projected economic toll of weather and climate disasters across the United States since 1980. It assess trends related to specific types of disasters—such as wildfires or hurricanes—as well as across regions, sectors, and over the course of decades. Such an analysis inherently reflects uncertainty associated with both historic impacts, for which data can be limited, as well as for future projections, which depend on future emissions scenarios and complex climate modeling. This analysis largely discusses total economic impacts of these disasters, but this metric is somewhat limited as well: it may be much harder for a low-income household to recover from the flooding of a less expensive house than for a wealthier household to recover from damage to a more expensive house, even if the total monetary damage of the latter is larger. Given these limitations, the report still aims to summarize the scale of weather and climate damage across the United States, the risk of escalating costs in a warming climate, and the need to rapidly invest in both climate mitigation and adaptation.

Disproportionate Impacts

Low-income communities, communities of color, and other historically underserved and overburdened face elevated risks from climate change. Recent research has found that future flooding is more likely to occur in low-income neighborhoods, communities of color, and places with a disproportionate share of industrial pollution (Marlow, 2022). Historically redlined communities which are still disproportionately home to people of color are more likely to be heat islands today (Plumer & Popovich, 2020), increasing risks for these populations as temperatures rise. Not addressing these inequities in climate policy risks exacerbating environmental health and socioeconomic inequities (Shonkoff et al, 2011), but targeted investments co-designed with communities can help reduce the disproportionate impacts of extreme weather (NASEM, 2022).

View Report »

Sign Up for Email Updates


"*" indicates required fields

This field is for validation purposes and should be left unchanged.

Our Latest Press Releases


Releases

E2: Repealing EPA’s Endangerment Finding For Vehicle Emissions Raises Costs for Businesses and Consumers

The EPA officially revoked the endangerment finding for greenhouse gas (GHG) emissions and eliminated clean vehicle standards in a blow to both our economy and our environment.


Releases

E2: Companies Cancelled $34.8B, 38K Jobs for Clean Energy Projects in 2025, Outpacing New Investments 3-to-1

Businesses abandoned $5.1 billion in large-scale factories and clean energy projects in December, capping a turbulent year for the sector that saw nearly $35 billion in investments disappear along with more than 38,000 current and future jobs, according to ...


Releases

E2: Trump Administration’s Latest Attempt to Kill Offshore Wind Hurts Consumers, Businesses

The Trump administration is trying to halt offshore wind projects that are well-underway just two weeks after their initial attempt was deemed arbitrary and capricious by a federal judge.


Donate Today