Date: March 27, 2018
Michigan’s clean energy economy is clearly thriving.
But where is all this economic activity happening?
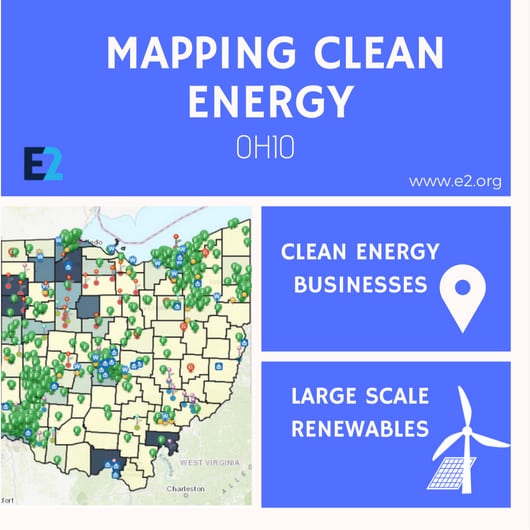
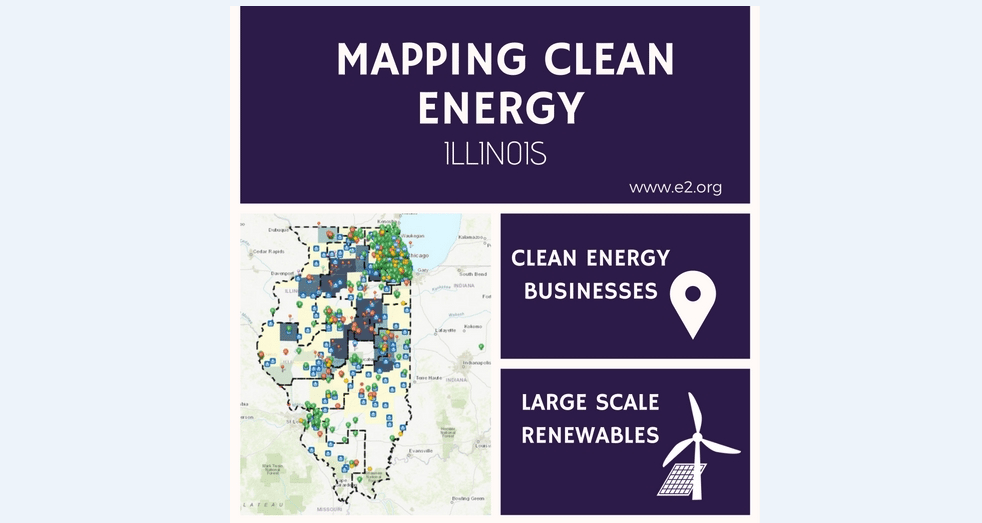
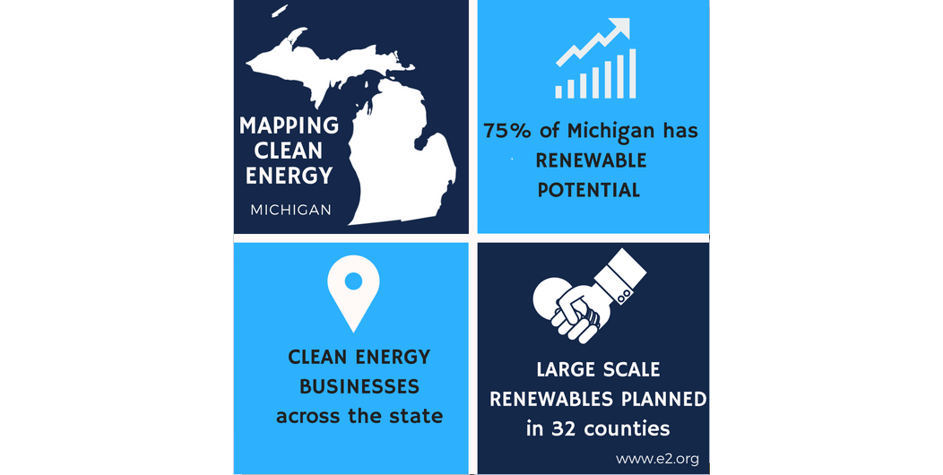
That’s exactly what E2 — along with our partners at FracTracker Alliance — attempted to find out with this series of interactive maps showing the location of more than 1,200 clean energy businesses across the state as well as sites where renewable energy is generated.
 Since Michigan passed legislation in 2008 requiring utilities to generate 10% of their electricity from renewables by 2015, we’ve seen the state’s clean energy economy grow. Then in December of 2016 lawmakers decided to uphold and improve aspects of the state’s clean energy standards. The renewable portfolio standard was increased and new energy efficiency incentives were created to push utilities to do more. With recently strengthened laws, it is no surprise that Michigan’s clean energy sector – as seen on this series of maps – is so robust.
The purpose of these maps is to help policymakers, press and individuals better understand the scope of Michigan’s clean energy economy – and how much room it has to grow.
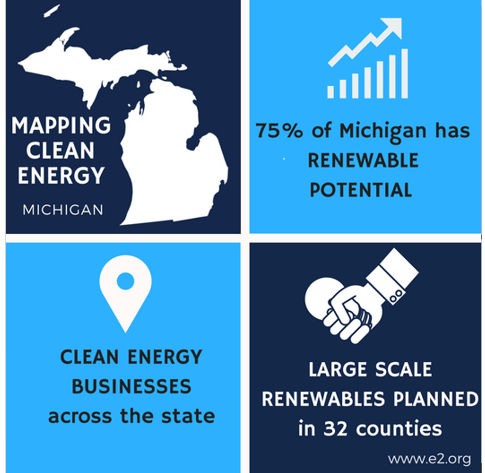
Key Takeaways
- There are over 1,200 businesses displayed in the map, which includes energy efficiency contractors and renewable energy (solar, wind, and geothermal) installers, covering all 38 state senate districts and all 110 state house districts.
- Approximately 75 percent of the state has potential for either wind, solar or geothermal power.
- 32 counties already have large-scale renewable energy projects, which many more projects in the queue waiting to be built
We’ve done our best to capture as many businesses as possible but if you know we’ve missed something, please send an email to Micaela Preskill ([email protected]) and we’ll add it to the map. This map isn’t comprehensive; it represents one snapshot in time of an industry to help you understand just how robust it is, and where it still has room to grow.
How to Use the Maps:
We’ve created 3 maps to show different parts of Michigan’s clean energy economy. One map shows clean energy businesses, one shows renewable energy utility-scale infrastructure, and one shows renewable energy potential.
When viewing the map, zoom in to see the intricacies of what’s happening in each part of the state. If you click “Layers” on the black bar at the top of the map you will see a drop-down menu, which you can use to make data appear or disappear on the map.
For more information about what you’re seeing, click directly on the map. A pop-up box will appear to show you specifics. Use the arrows on the top right of the pop-up box to see all the information that applies to that spot on the map. For example, if you click on a pin representing a energy efficiency contractor, you’ll see information about that business. You can also use the arrow to see what legislative districts that business is in.
The Maps
The Clean Energy Business Map shows locations of energy efficiency contractors and solar, wind and geothermal installers.
Clean Energy Businesses
The Renewable Energy Infrastructure Map shows utility-scale wind and solar generation facilities larger than 1 MW and schools with solar energy generation.
Renewable Energy Infrastructure
The Renewable Potential Map shows the potential for wind, geothermal and solar power generation.
Renewable Energy Potential
Other Resources:
View Report »