Clean Jobs Rural Midwest
Growing Rural Economies
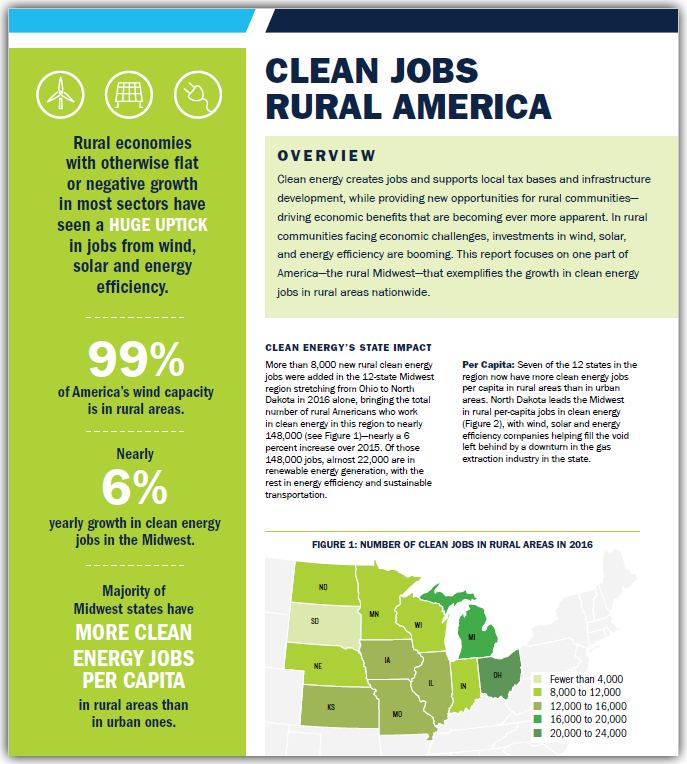
Clean energy creates jobs, supports local tax bases and infrastructure development, while providing new opportunities for farmers—driving economic benefits that are becoming ever more apparent. In rural communities facing economic challenges, investments in wind, solar, and energy efficiency are growing. This report from E2 focuses on one part of America – the rural Midwest – that exemplifies the growth in clean energy jobs in rural areas nationwide.
More than 8,000 new rural clean energy jobs were added in the 12-state Midwest region stretching from Ohio to North Dakota in 2016 alone, bringing the total number of rural Americans who work in clean energy in this region to nearly 148,000 (see Figure 1)—nearly a 6 percent increase over 2015. Of those 148,000 jobs, almost 22,000 are in renewable energy generation, with the rest in energy efficiency and sustainable transportation.
Key Findings
- Majority of Midwest states have more clean energy jobs per capita in rural areas than urban ones
- Clean energy employment represents a bright spot in rural communities that have otherwise lost population and jobs
- Clean energy jobs in the Midwest are growing 6% a year
- 99% of U.S. wind capacity is in rural areas
- Nearly 150,000 rural Midwesterners work in clean energy, including almost 22,000 in renewable energy generation
- More than 8,000 new rural clean energy jobs were added in rural Midwest areas in 2016 alone
Looking for More Info?

This report follows E2’s Clean Jobs America analysis which found the clean energy jobs account for nearly 3.3 million jobs across all 50 states and the District of Columbia. Both reports expand on data from the U.S. Energy and Employment Report (USEER) produced by the Energy Futures Initiative (EFI) in partnership with the National Association of State Energy Officials (NASEO), using data collected and analyzed by the BW Research Partnership. E2 is a partner on the USEER, the fourth installment of the energy survey first released by the Department of Energy in 2016. Clean energy jobs have grown every year since the first report was released in 2016.
If you are looking for additional insight into E2’s Clean Jobs Rural Midwest 2018 or our other Clean Jobs America reports, visit e2.org/reports. You can also contact E2 Communications Director Michael Timberlake ([email protected]). An FAQ is also available here to answer any questions.
Download
The complete report is available for download at this link.
View Report »