Date: April 4, 2019
32% clean energy job growth in 2018 leads all U.S., positions Nevada to become energy storage hub
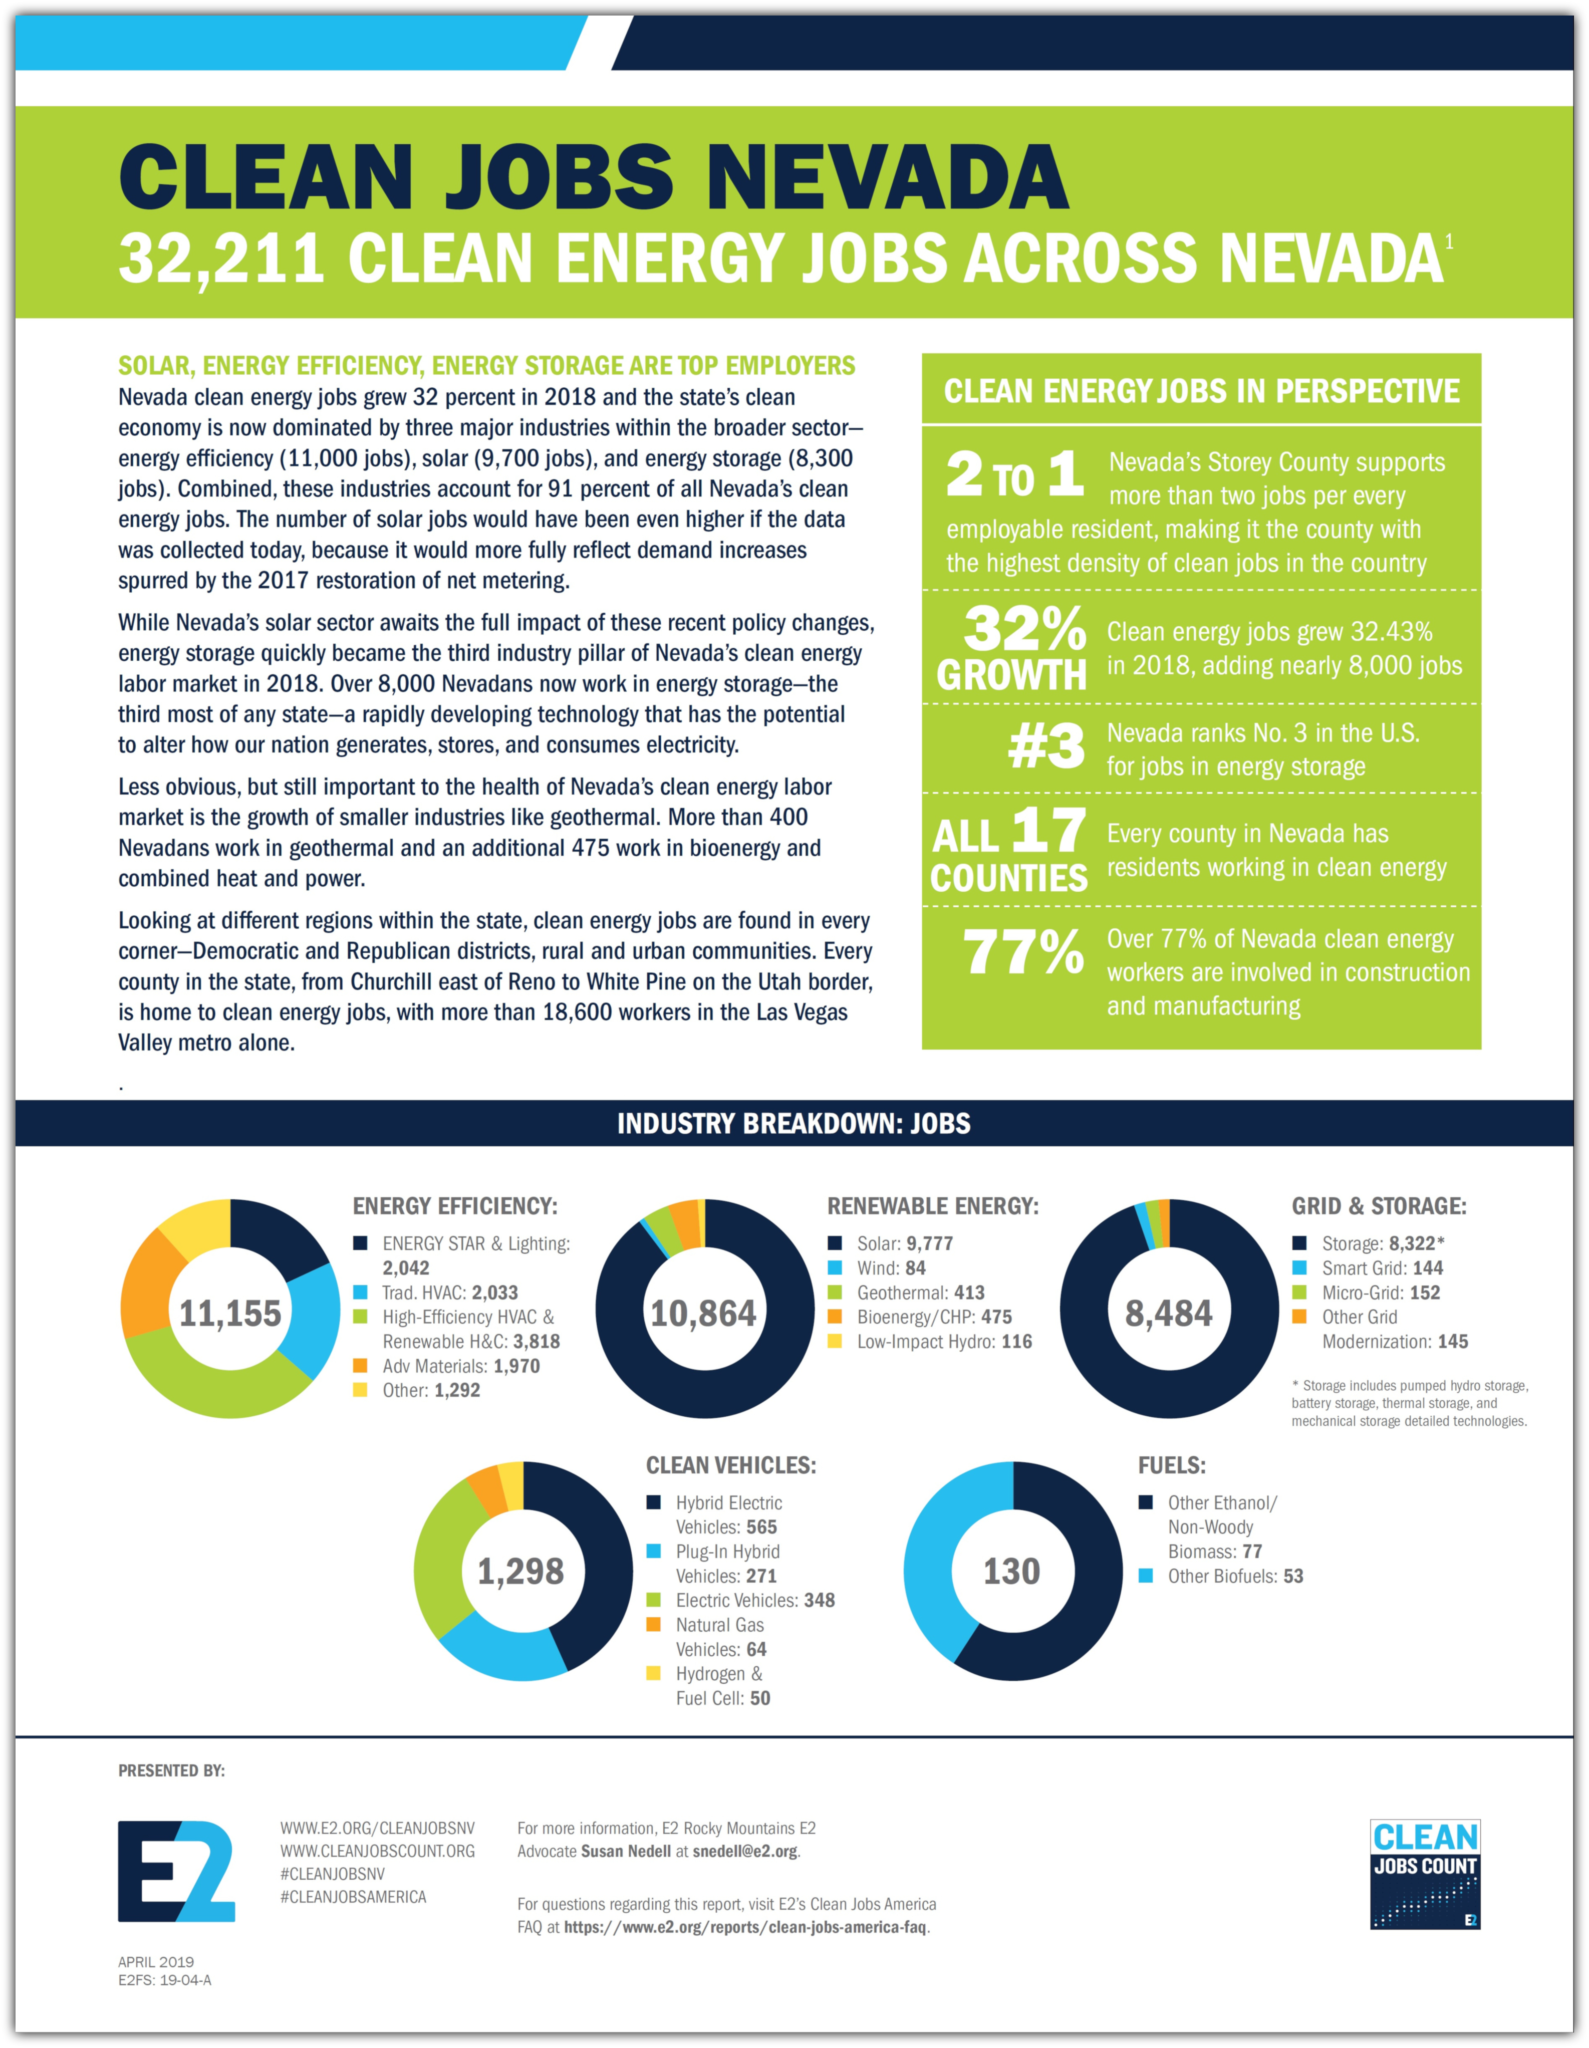
According to the 2019 Clean Jobs Nevada analysis (downloadable PDF) of energy jobs data by the national nonpartisan business group E2 (Environmental Entrepreneurs), Nevada’s clean energy economy exploded in 2018 — adding nearly 8,000 jobs and making the state no. 1 clean energy job growth (32.4%).
Overall, clean energy jobs totaled more than 32,000 at the end of 2018, with the biggest benefactor being Storey County near Reno, home to Tesla’s Gigafactory battery plant. More than 8,100 Nevadans now work in clean energy in Storey County – giving it the highest density of clean energy jobs in the country, with 2,300 jobs per 1,000 employable residents.
Nevada’s wider clean economy is now dominated by three major industries within the broader sector— energy efficiency (11,000 jobs), solar (9,700 jobs), and energy storage (8,300 jobs). Combined, these industries account for 91 percent of all Nevada’s clean energy jobs. The number of solar jobs would have been even higher if the data was collected today, because it would more fully reflect demand increases spurred by the 2017 restoration of net metering.
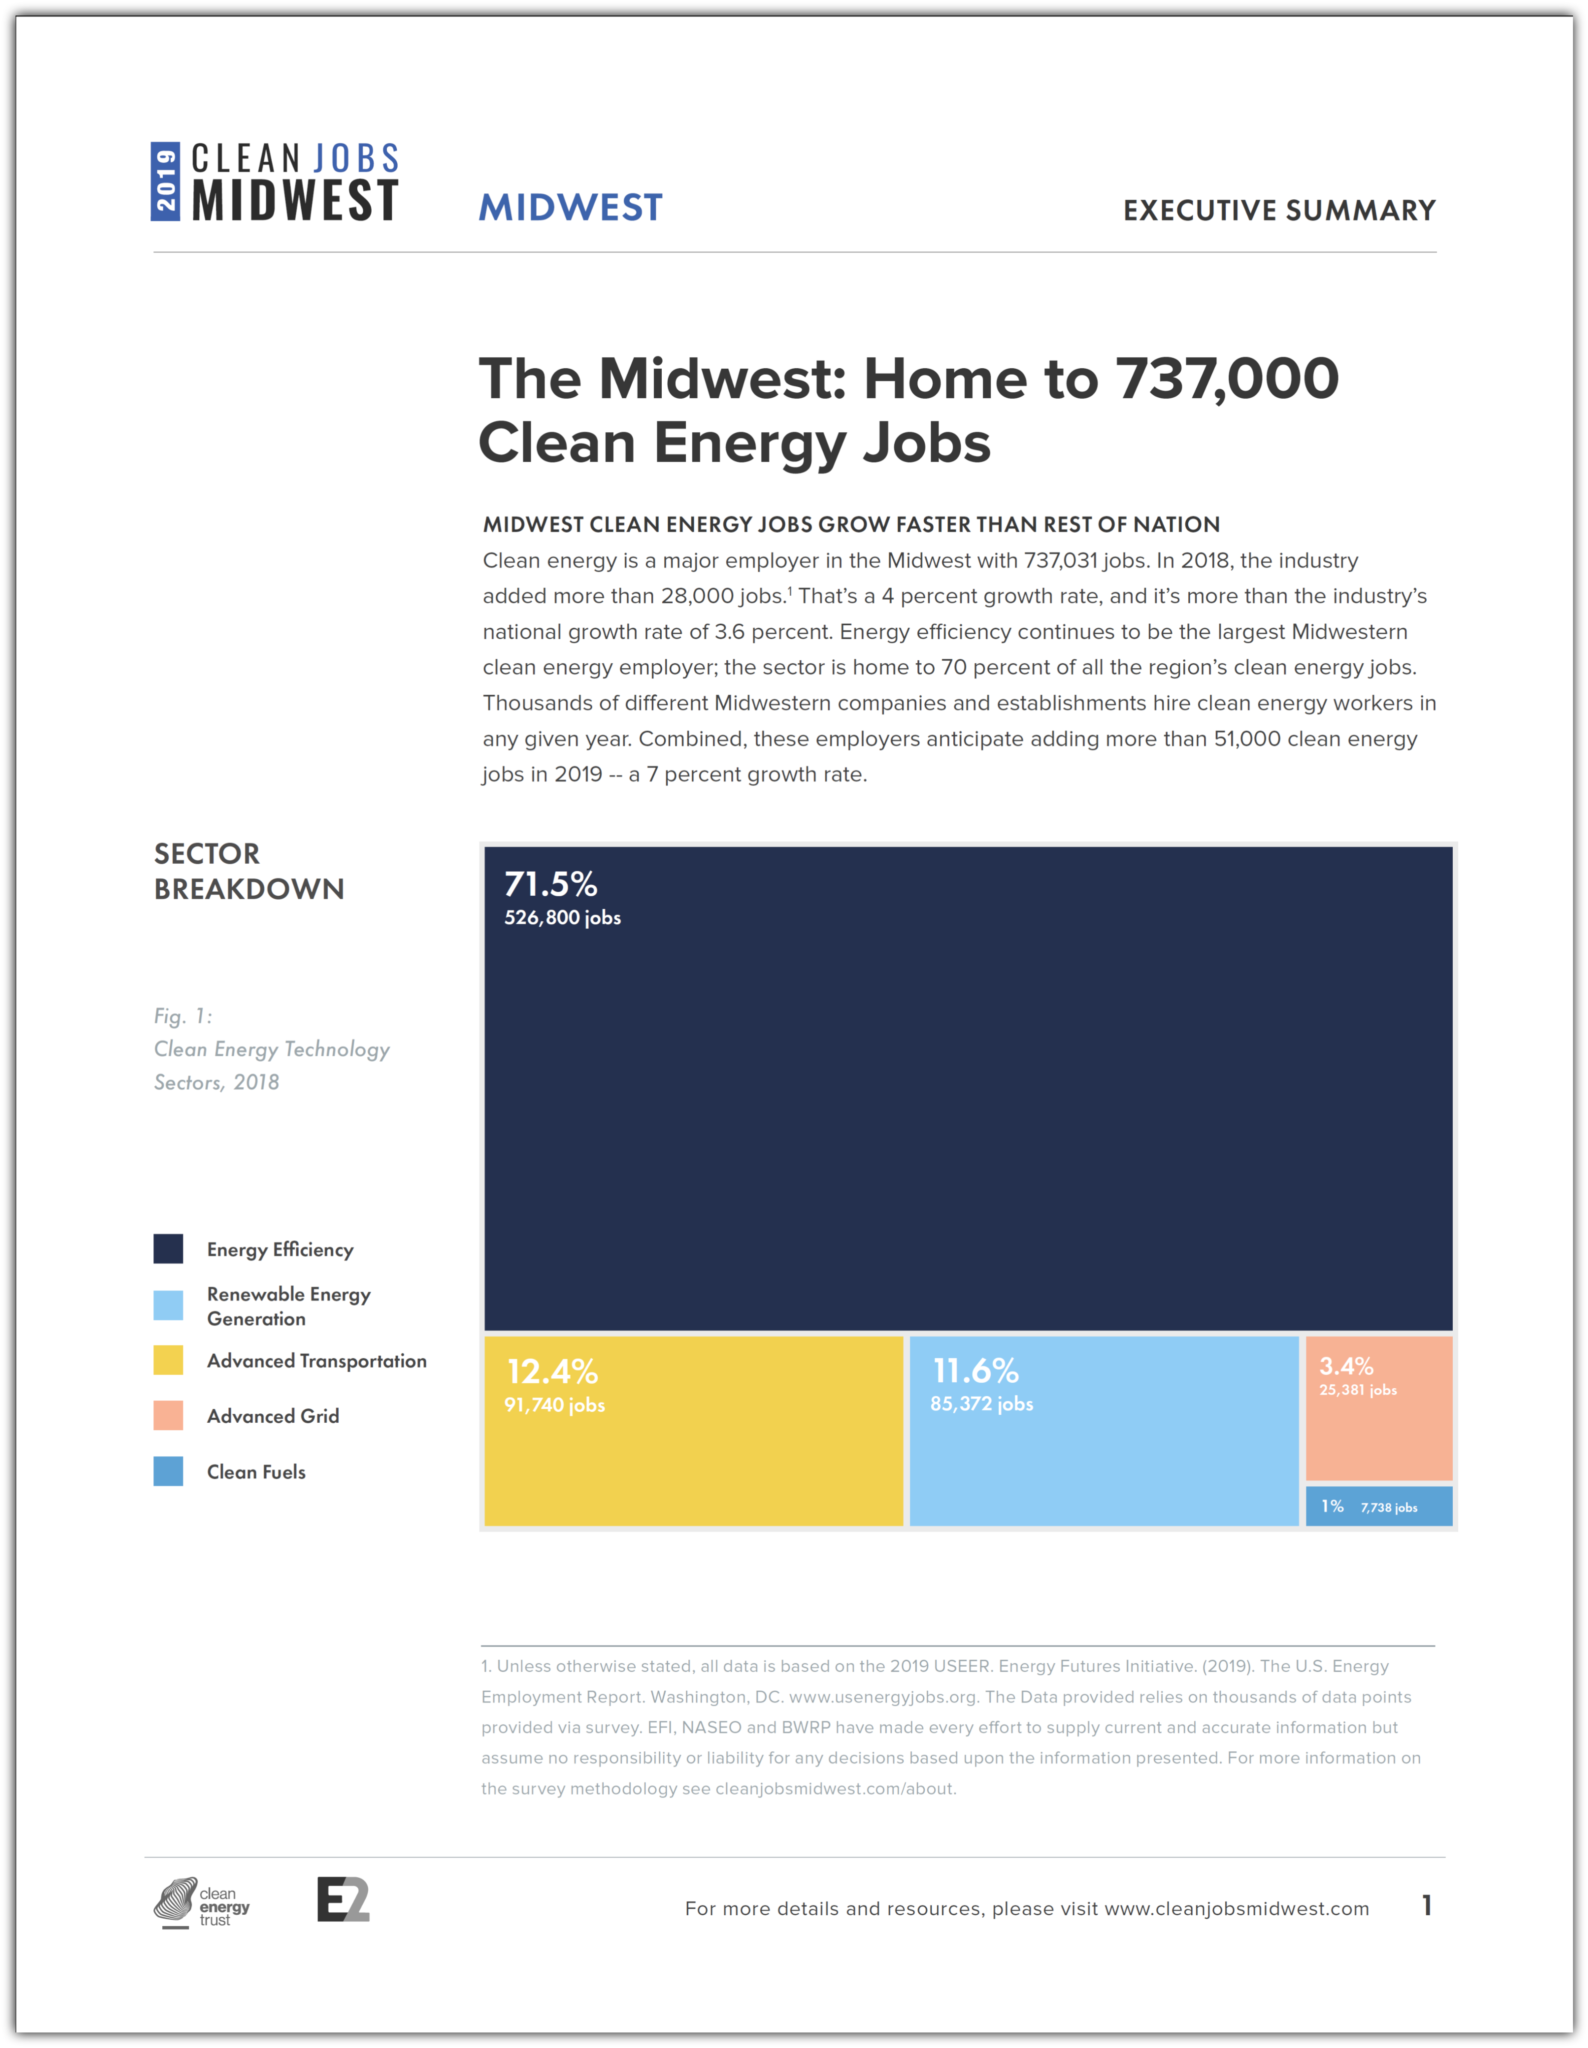
NEVADA JOB SECTOR TOPLINES
- Energy Efficiency – 11,155 obs
- Renewable Energy – 10,864 jobs
- Energy Storage – 8,322 jobs
- Solar Energy – 9,777 jobs
- Clean Vehicles – 1,298 jobs
- Grid Modernization – 441 jobs
- ALL Clean Energy Sectors – 32,211 jobs
OTHER HIGHLIGHTS
- Storey County is home to more than two jobs per every employable resident
- Nevada ranks 3rd among all U.S. states for jobs in energy storage
- Clean energy employs 5X more Nevadans than fossil fuels
- 77 percent of jobs are in the construction and manufacturing sectors
- The Las Vegas Valley and Reno-Sparks metro areas account for 92 percent of Nevada’s clean jobs
- All 17 counties in Nevada are home to jobs in clean energy
- Nearly 11,000 Nevadans work in renewable energy
- Nevada’s 413 geothermal jobs rank in the top 10 nationally
- Churchill, Douglas, and Lincoln counties all support more than 20 clean energy jobs per 1000 employable residents
- 1,300 Nevadans work in non-sales positions involving hybrid and electric vehicles and clean fuels
Looking for More Info?
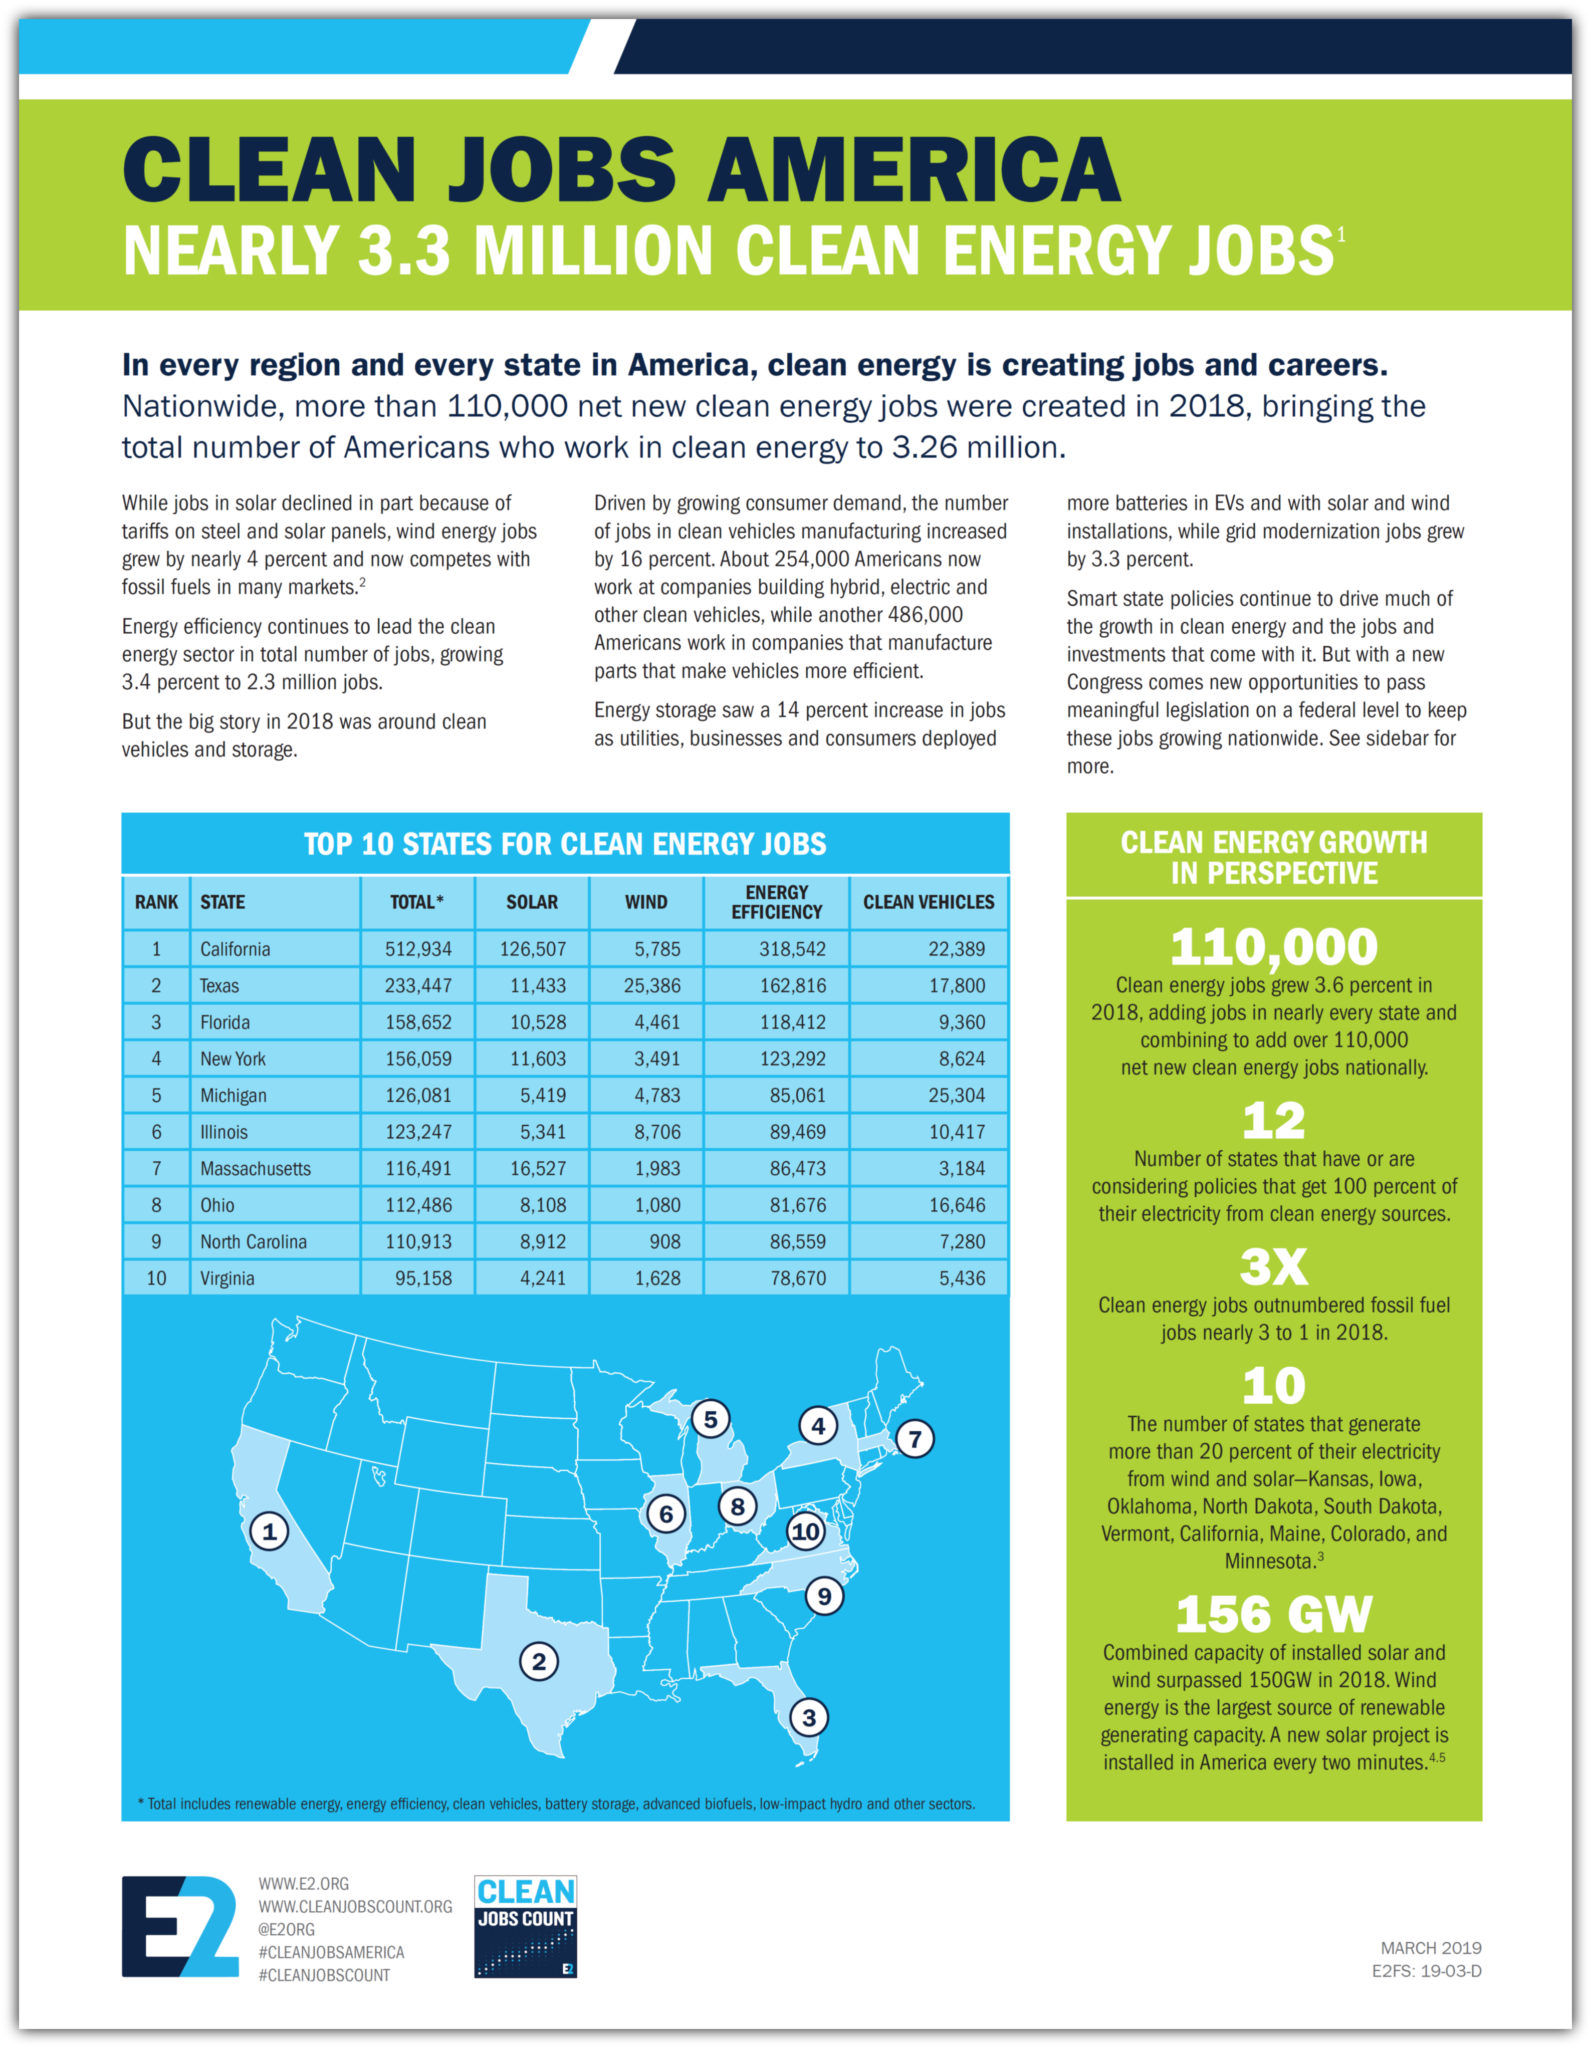
This report follows E2’s Clean Jobs America analysis which found the clean energy jobs account for nearly 3.3 million jobs across all 50 states and the District of Columbia. Both reports expand on data from the 2019 U.S. Energy and Employment Report (USEER) produced by the Energy Futures Initiative (EFI) in partnership with the National Association of State Energy Officials (NASEO), using data collected and analyzed by the BW Research Partnership. E2 is a partner on the USEER, the fourth installment of the energy survey first released by the Department of Energy in 2016. Clean energy jobs have grown every year since the first report was released in 2016.
If you are looking for additional insight into E2’s Clean Jobs Nevada 2019 or our other Clean Jobs America reports, visit e2.org/reports. You can also contact E2 Communications Director Michael Timberlake ([email protected]). An FAQ is also available here to answer any questions.
DOWNLOAD
The complete report is available for download at this link.
OTHER CLEAN JOBS REPORTS
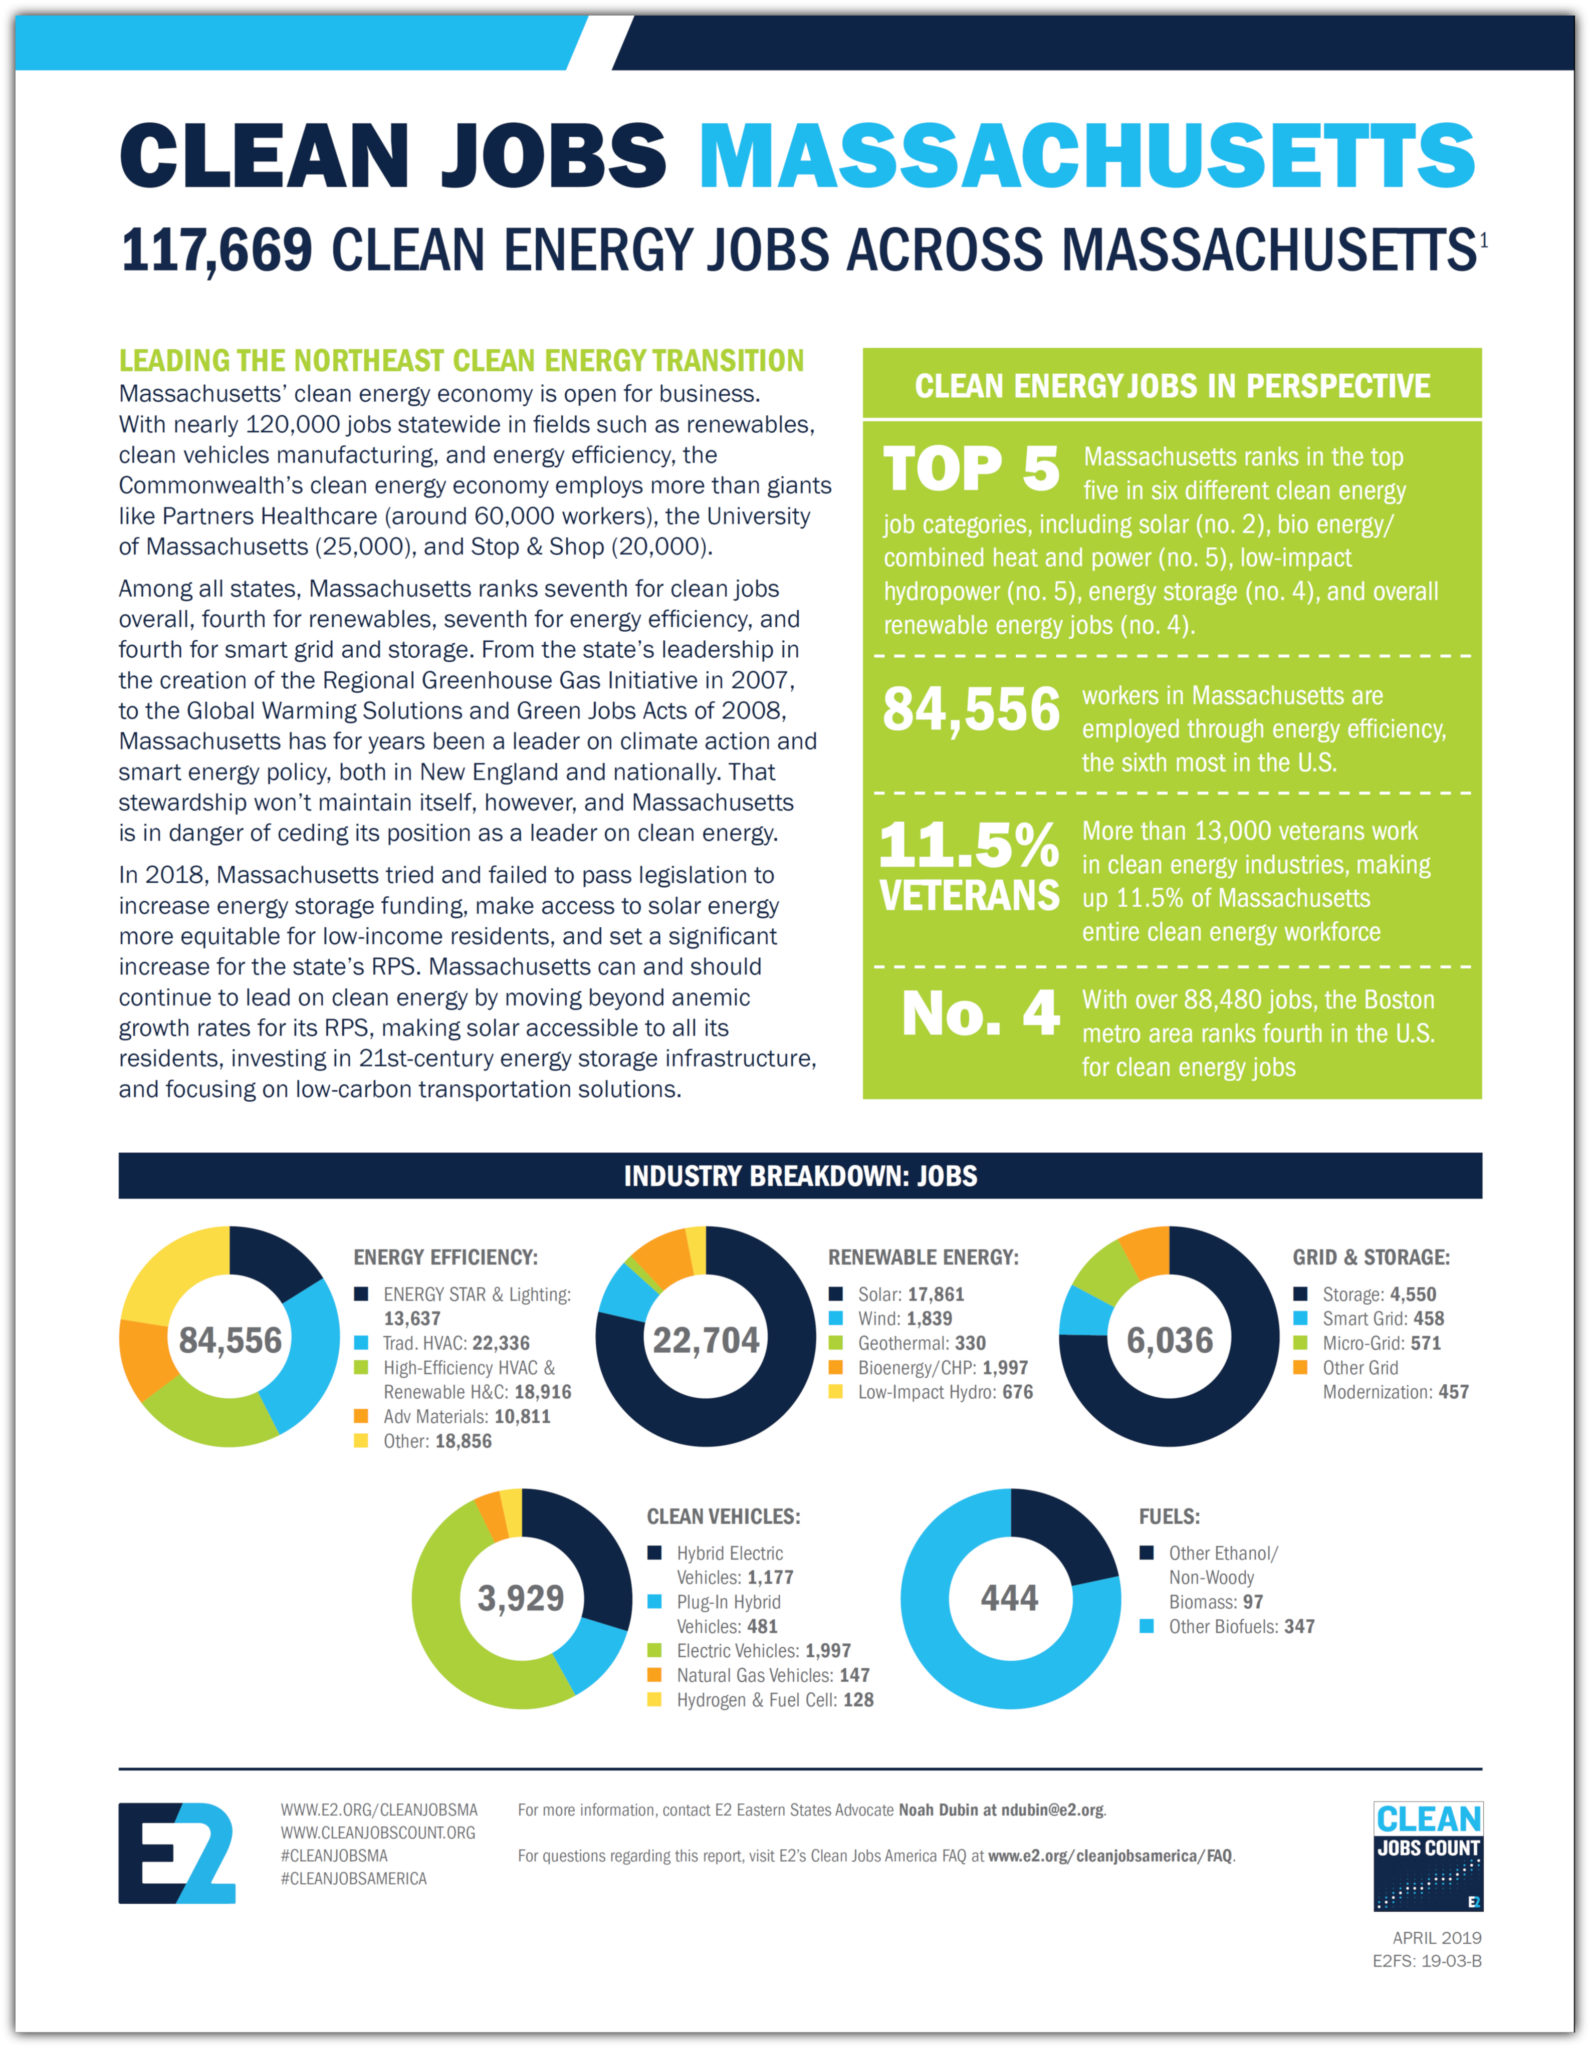
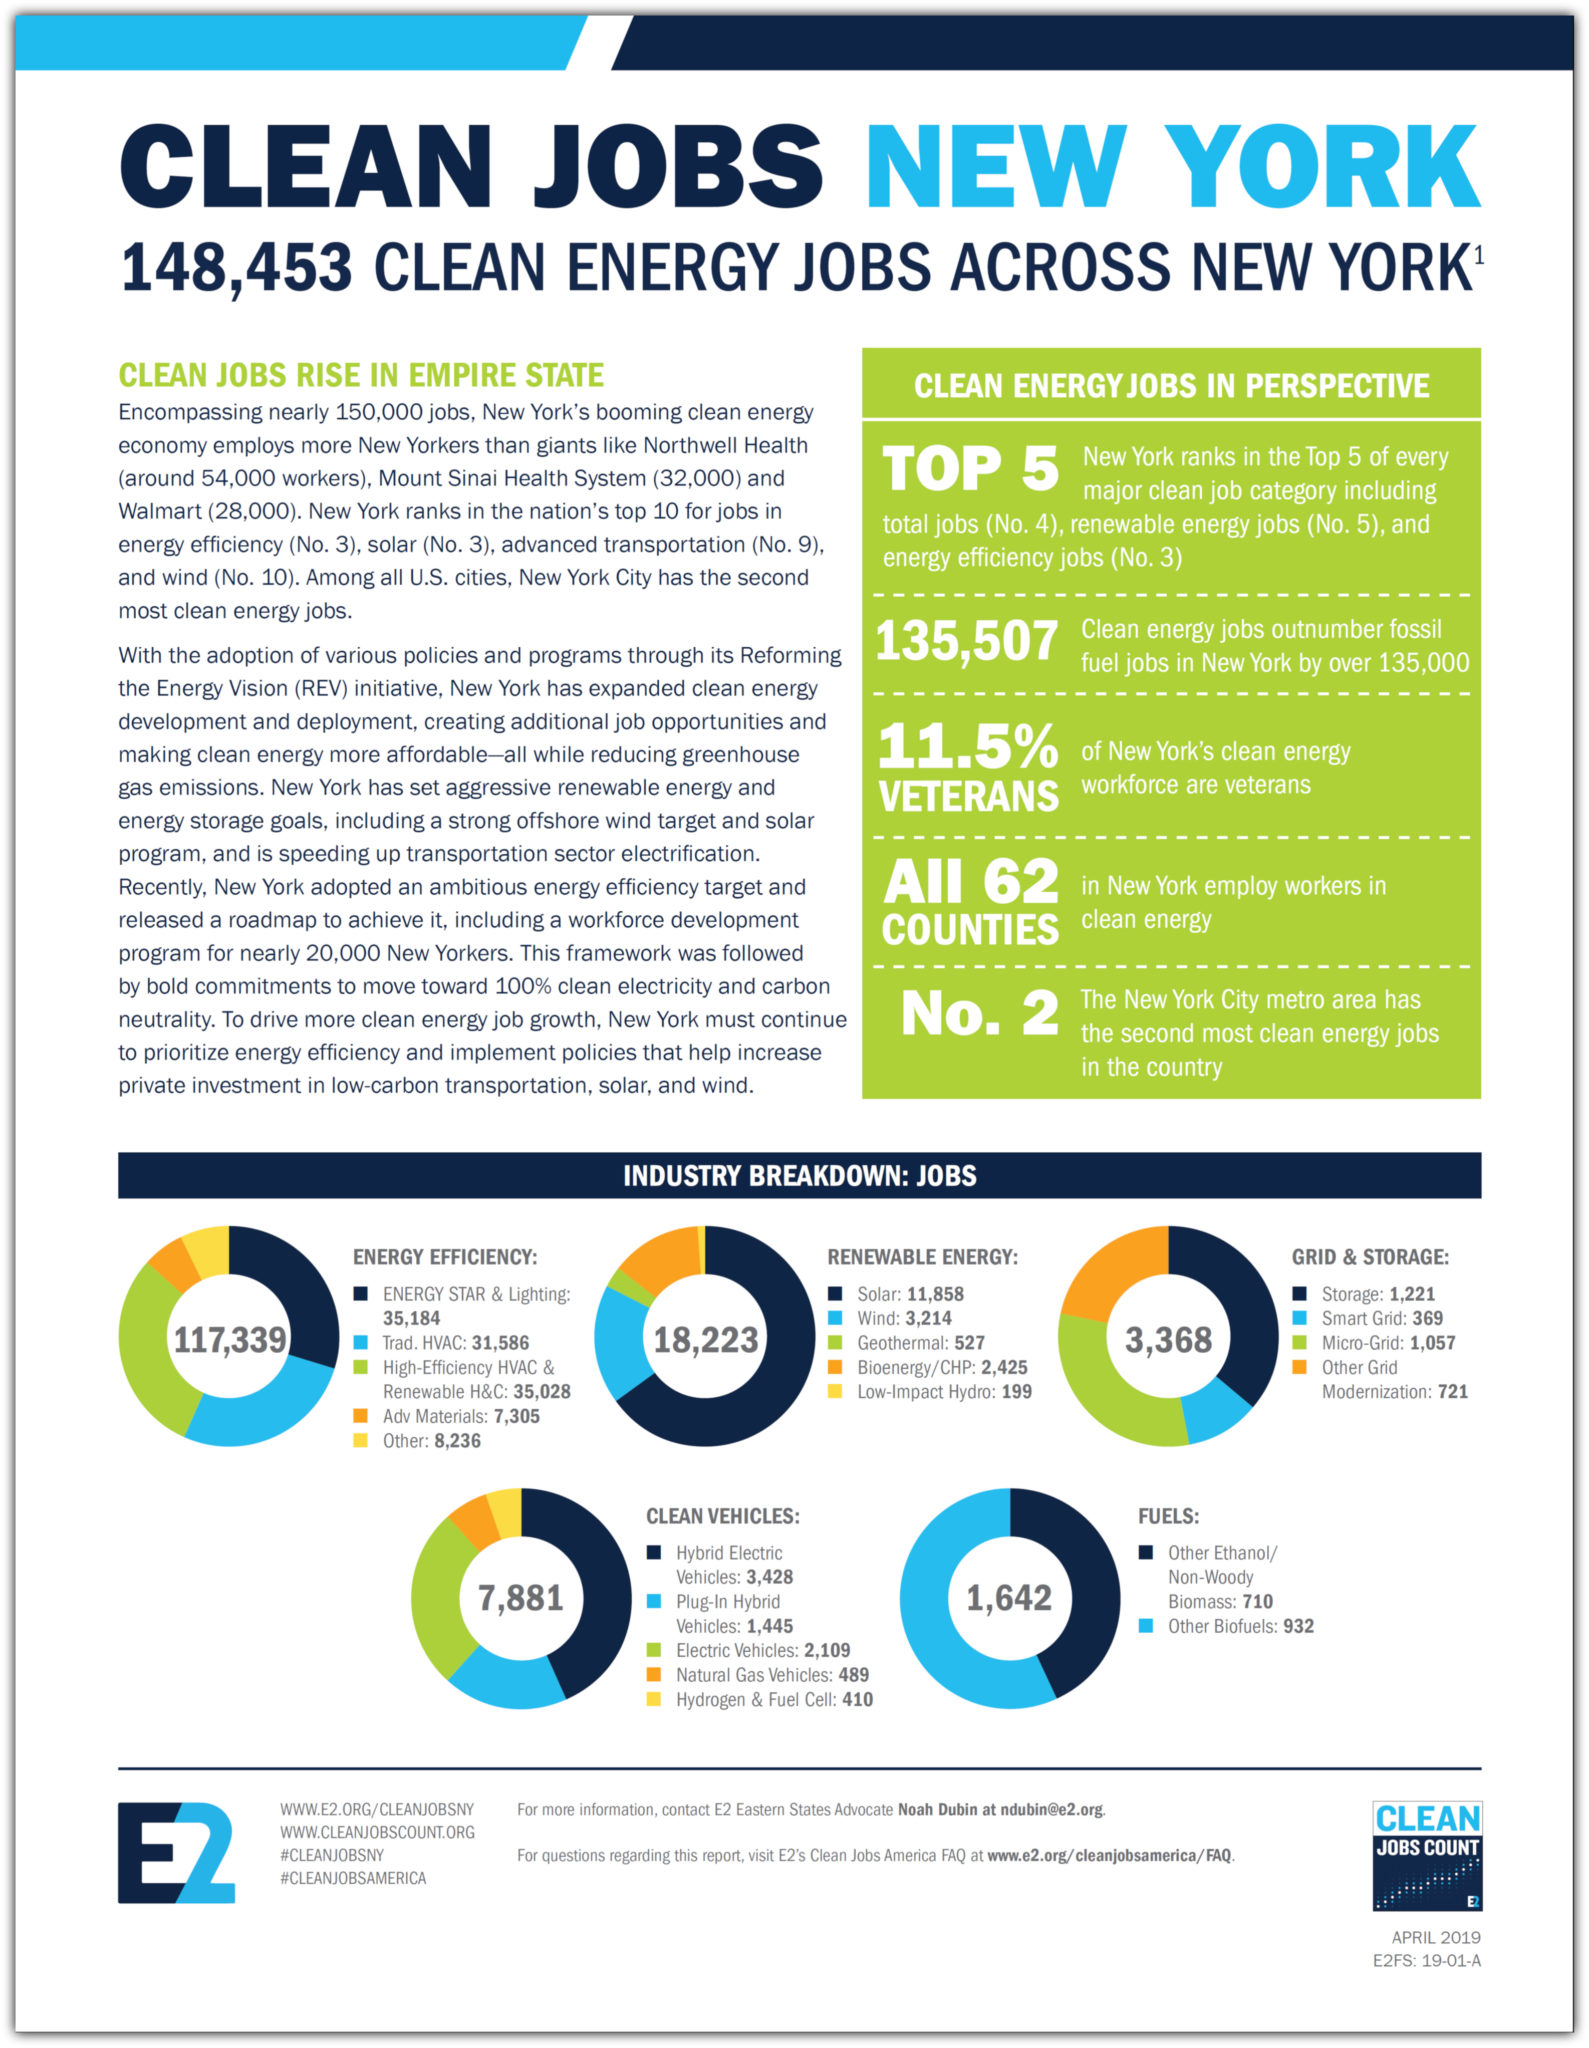
Clean Jobs Nevada is only one in a series of state and industry reports produced by E2 and our partners.
View Report »

 If New York, New Jersey, Virginia, North Carolina, and South Carolina added an average-sized offshore wind energy farm (352 MW), nearly 25,000 jobs and $3.6 billion would be added to the states’ economies.
