But what, exactly, does the economic activity happening all across the state look like?
E2 — along with our partners at FracTracker Alliance, and in continuing partnership with New Yorkers for Clean Power and the Alliance for Clean Energy New York — attempted to find out.
We compiled a series of four maps showing the location of clean energy businesses across the state as well as sites where renewable energy is generated.
The purpose of the maps is to help policymakers, press and individuals better understand the scope of New York’s clean energy economy — and how much room it has to grow.
Map user’s guide
When viewing the map, note the “Layers” option on the black bar at the top of the map. Click the drop-down menu to select different layers of information. When a layer is selected, a description of that layer is displayed in the left-hand column.
E2 and our partners at Clean Energy Trust released our 2017 “Clean Jobs Midwest” report, showing there are nearly 600,000 clean energy jobs in the 12-state region. Energy efficiency is the top sector, and across the Midwest clean energy jobs grew about five times faster than jobs in other sectors.
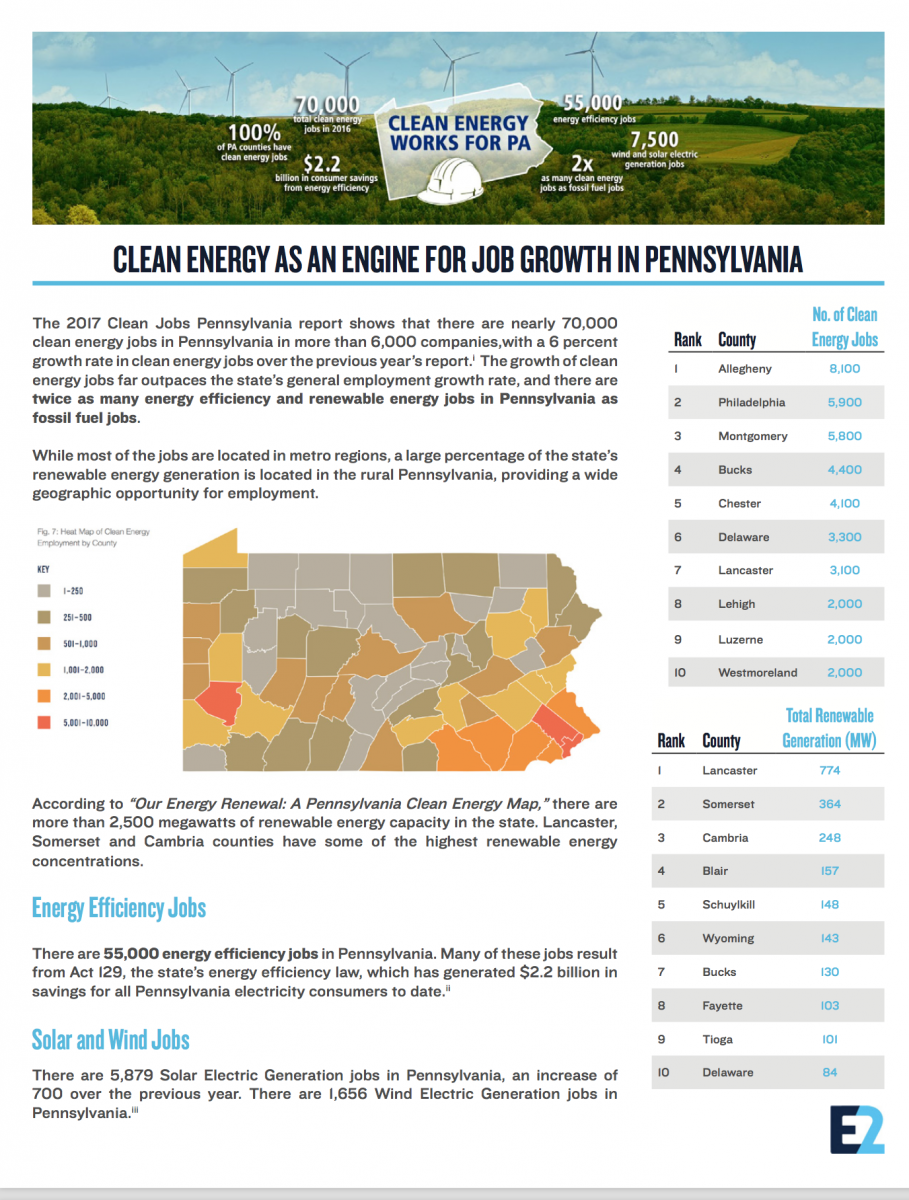
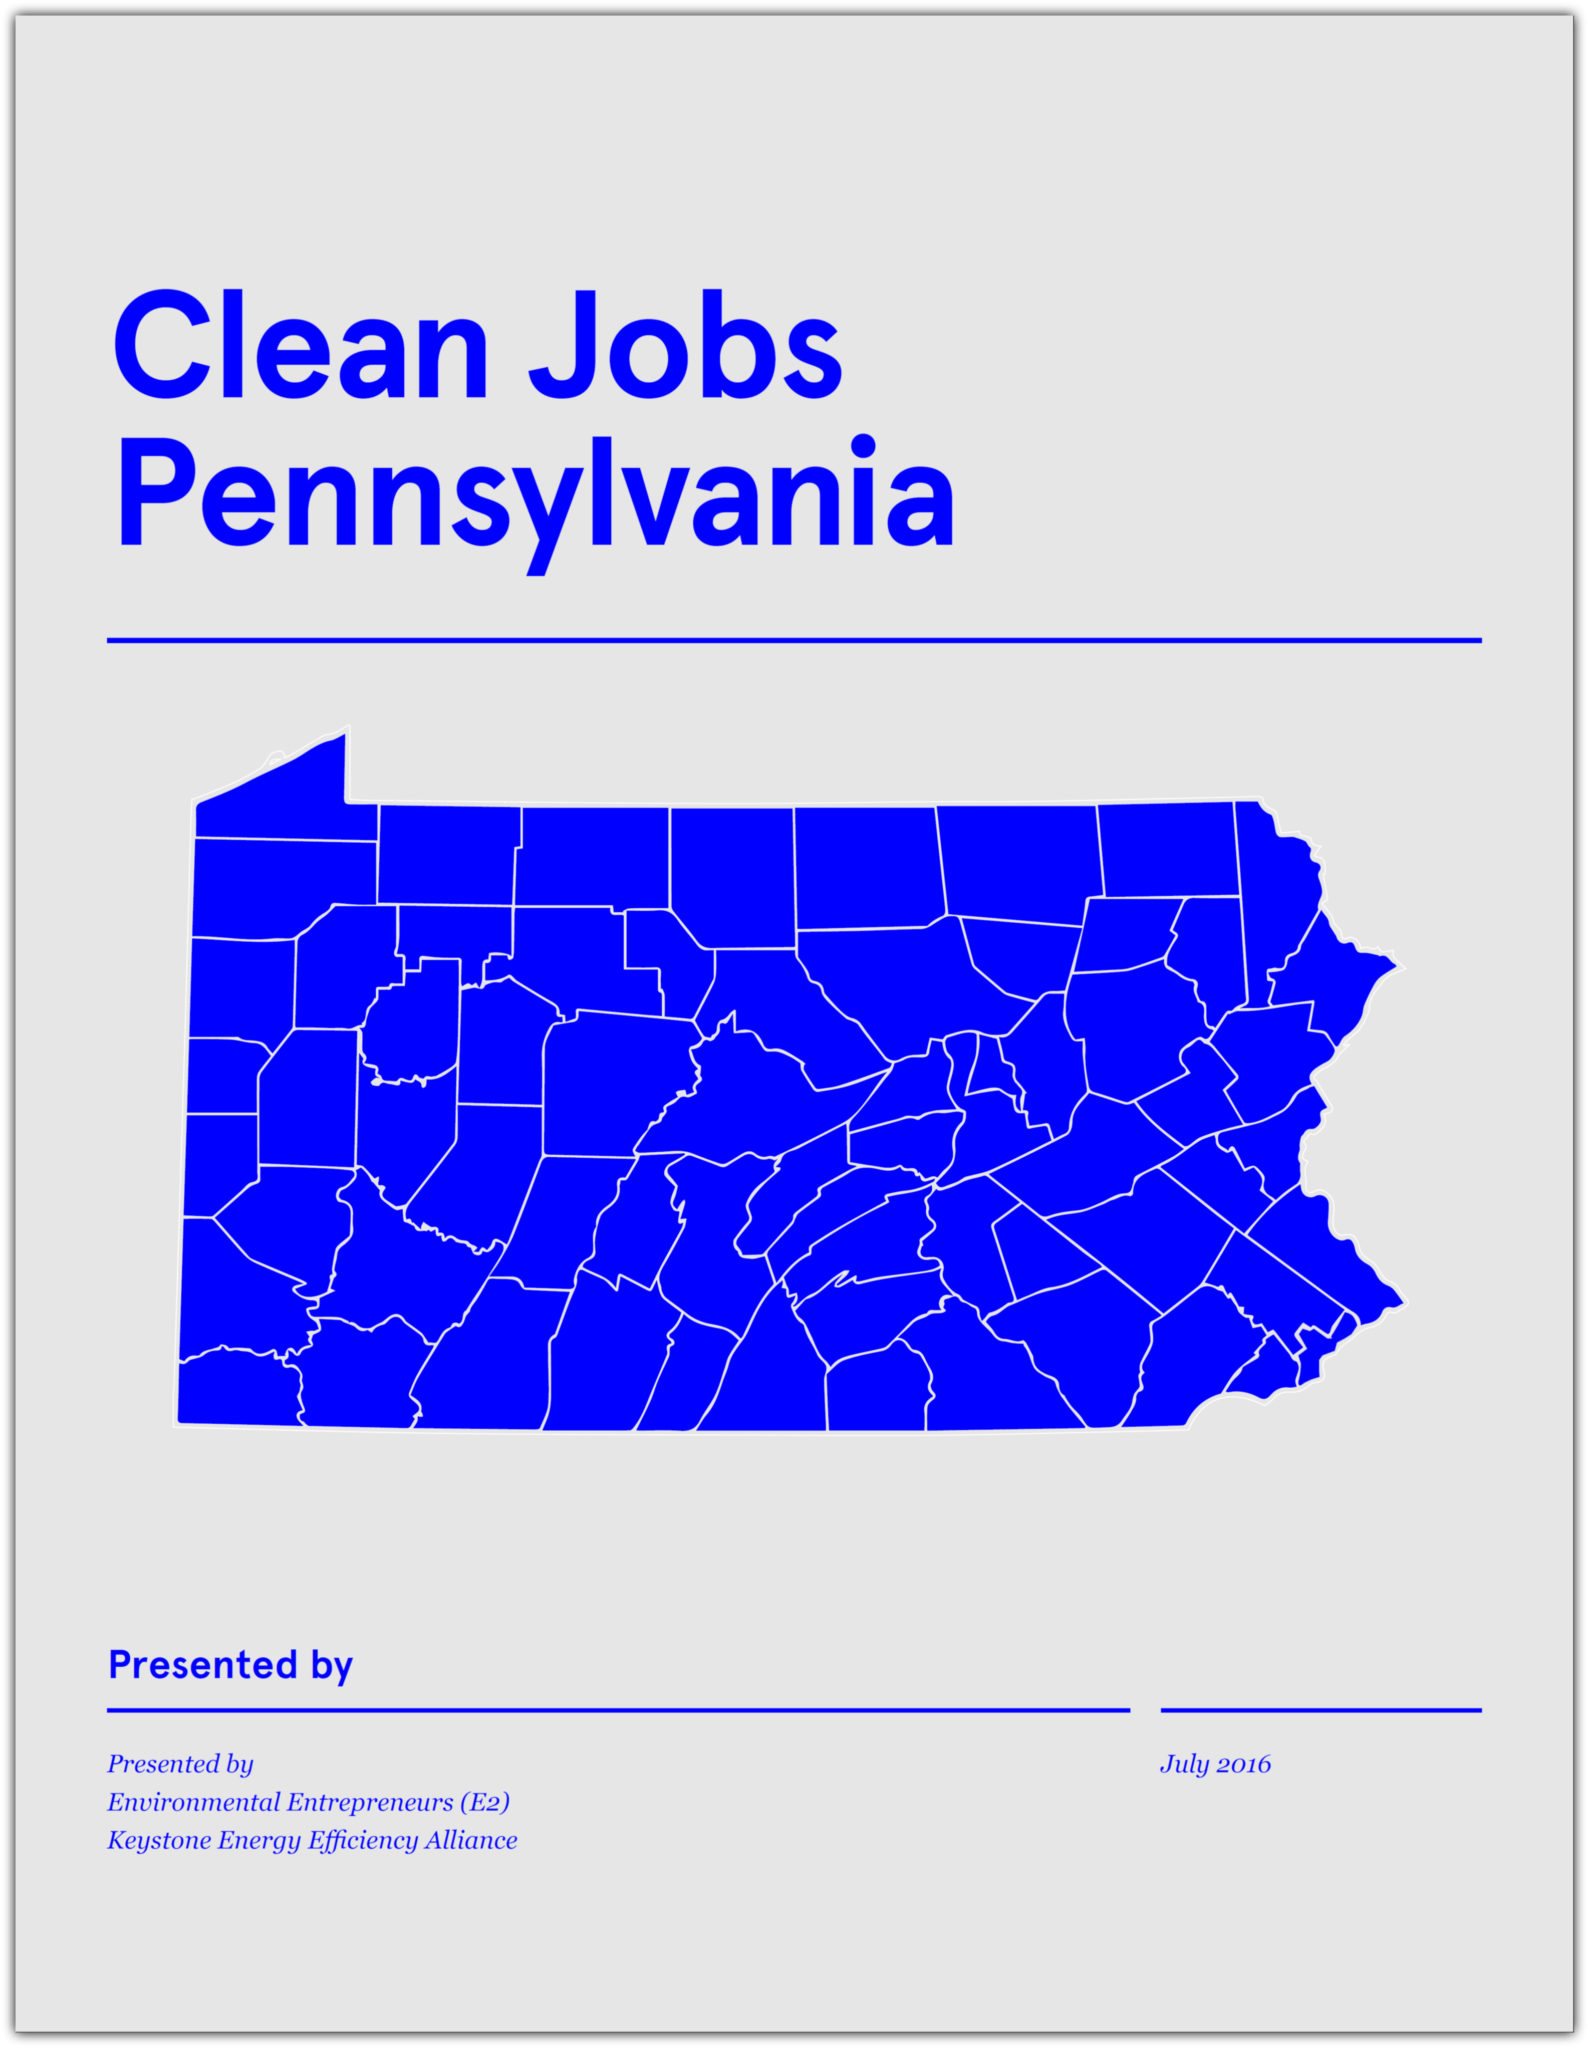
There are nearly 70,000 clean energy jobs in Pennsylvania, according to Clean Jobs Pennsylvania 2017 released in August 2017 by E2 and partners at the Keystone Energy Efficiency Alliance (KEEA). The complete report is available here and by clicking the cover:
Download and print a 2-page snapshot (pictured below) of the clean energy jobs data in Pennsylvania — and the policies needed to ensure more growth at the state ad federal levels here.
The Trump Administration’s effort to unwind the Clean Power Plan (CPP) represents a failure to capitalize on the economic and environmental benefits of clean energy.
Analysis shows that the CPP could create up to 560,000 jobs and add $52 billion to the gross domestic product (GDP) in 2030. From states with relatively small populations like Maine and Montana to highly populated states like Florida, the CPP could have substantial employment and economic benefits – benefits that would disappear with the Trump Administration’s repeal of the policy.
Policymakers should oppose any efforts to weaken or rescind the CPP because doing so would reduce the employment and economic opportunities that come with it. Policymakers should also pursue other smart clean energy policies that support great efficiency, renewable energy, electric vehicles, and grid modernization efforts, which would further grow our nation’s economy while accelerating the urgently needed transition to a low-carbon future
The Clean Jobs Colorado analysis was conducted for E2 by BW Research Partnership. It includes detailed jobs data down to the county, metropolitan area, congressional and state legislative district levels – making it the most comprehensive tally of clean energy jobs ever in Colorado.
Clean energy is a major economic opportunity for Nevada – but only if state lawmakers step up and strengthen certain policies, according to a new E2 policy paper.
Clean energy in Colorado has been steadily increasing in recent years. In this report, E2 outlines specific measures Colorado can take to improve its clean energy economy, including strengthening the RPS, incentivizing electric vehicles, and shoring up energy efficiency standards.
E2’s Pennsylvania Clean Energy Map shows the location of clean energy businesses across the state as well as sites where renewable energy is generated.
The purpose of the map is to help policymakers, press and individuals better understand the scope of Pennsylvania’s clean energy economy – and how much room it has to grow.
Here’s the map:
Rural areas hubs of clean energy activity
As our map shows, as of June 2016 Pennsylvania had more than 2,500 megawatts (MW) of renewable energy capacity from solar, wind and small hydroelectric plants.
Of that capacity, about half – or 1,300 MW – comes from wind, while nearly 1,000 MW comes from small hydroelectric plants. The remaining 240 MW comes from solar photovoltaic (PV) projects – i.e., the solar panels that you see on rooftops and in fields.
The majority of clean energy businesses are located in the Philadelphia and Pittsburgh metro areas and surrounding counties. However, as the map shows, less-urban counties actually have the most renewable energy generating capacity.
For example, Lancaster County has the largest renewable energy generating capacity in the state, with 720-plus MW. Lancaster Countyis a solar leader. Its 1,000 solar systems and its nearly 50 MW of solar PV power generating capacity are both tops in the state, mainly due to the large number of farms now using solar energy.
Chester County is the state’s No. 2 solar county with more than 800 solar systems and 21 MW of generating capacity.
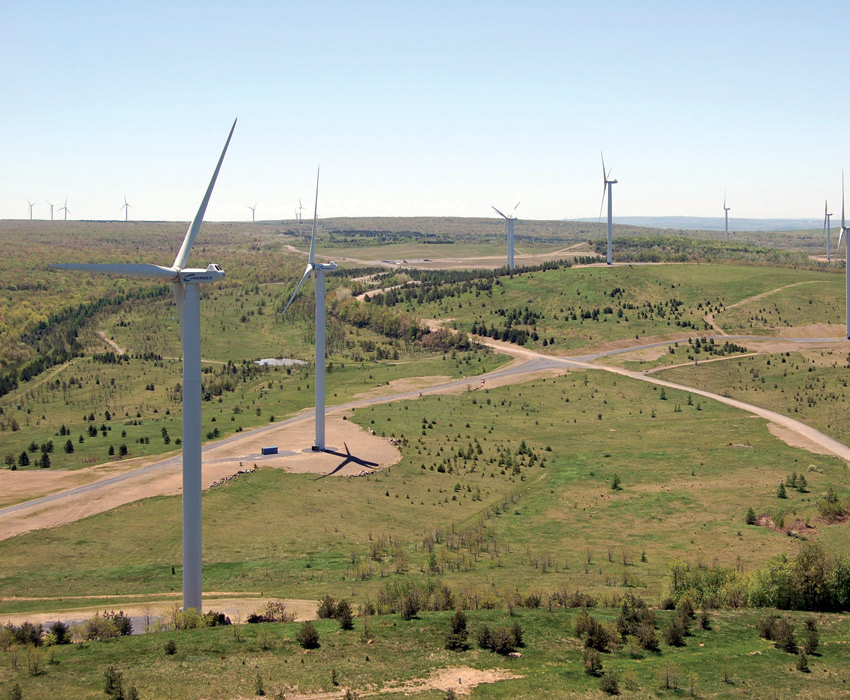
Cambria County’s Highland Wind Farm was developed on an old strip mine. (Photo courtesy of EverPower Wind Holdings)
Further west, Somerset and Cambria counties are Nos. 2-3 when it comes to overall renewable energy generating capacity, with 360-plus MW and about 250 MW, respectively. Both rely on wind for most of their renewable energy capacity.
The 62.5 MW Highland Wind Farm in Cambria County, for example, was brought online in 2009 by EverPower Wind Holdings. Situated on a reclaimed strip mine, nine full-time workers maintain and operate its 25 turbines.
Top 10 counties in PA for renewable energy generation
Ranking
County
Total Renewable Generation (MW)
1
Lancaster
774
2
Somerset
364
3
Cambria
248
4
Blair
157
5
Schuylkill
148
6
Wyoming
143
7
Bucks
130
8
Fayette
103
9
Tioga
101
10
Delaware
84
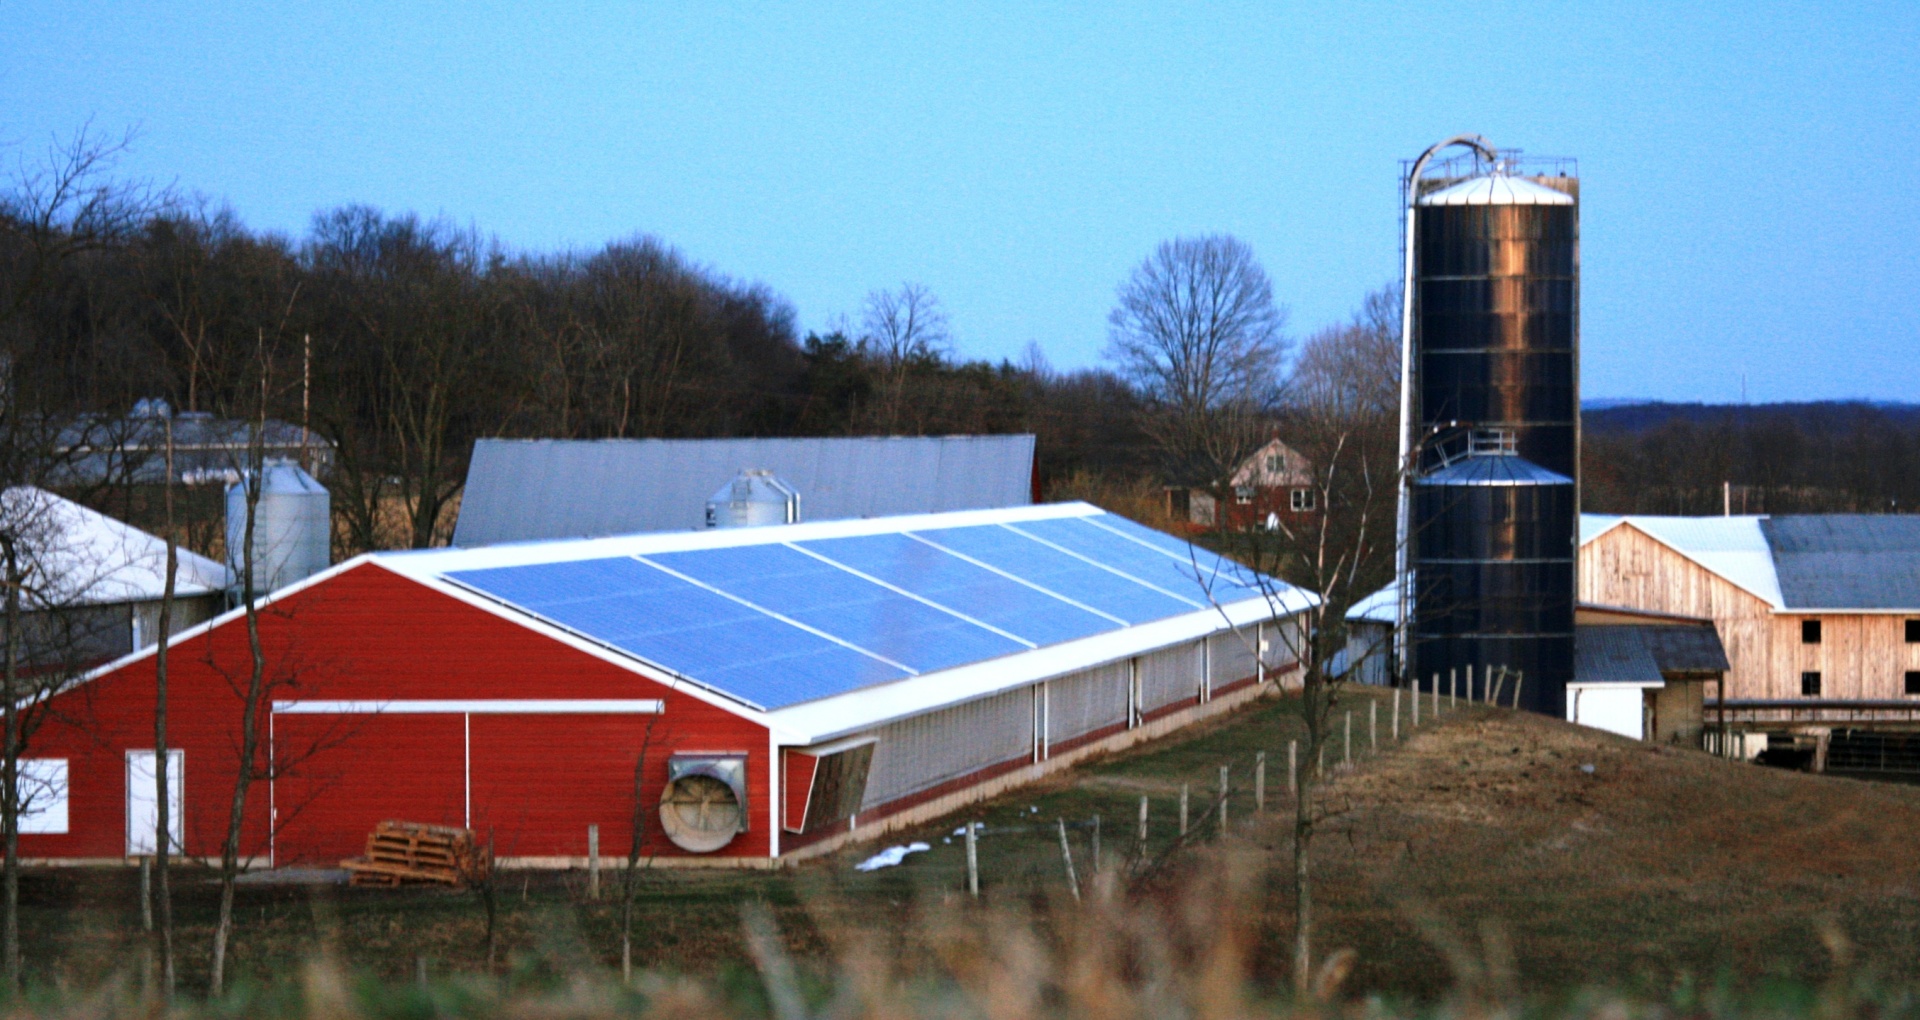
At Focus Farm, a turkey farm in Lewisburg, a rooftop solar array installed by Energy Independent Solutions helped create jobs in a rural part of Central Pennsylvania. (Photo courtesy of EIS Solar)
6,000 clean energy businesses in Pennsylvania
As outlined in E2’s “Clean Jobs PA” report, there are 66,000 clean energy jobs at nearly 6,000 clean energy businesses in Pennsylvania. This was based on data collected from the U.S. Bureau of Labor Statistics and from a BW Research Partners survey of hundreds of Pennsylvania companies.
Map user’s guide
When viewing the map, note the “Layers” option on the black bar at the top of the map. Click the drop-down menu to select different layers of information. When a layer is selected, a description of that layer is displayed in the left-hand column.
The Clean Energy Businesses layer shows locations of businesses involved in the solar, energy efficiency, geothermal, and “other” sectors. See “Registry” for the types of businesses included. When clicking the icon on the map, the user can view information about that particular business.
The Utility-ScaleRenewable Energy Facilities layer shows utility-scale wind, solar and hydroelectric generation facilities larger than 1 MW. This information is derived from the U.S. Energy Information Agency, retrieved July 2016. [Source: http://www.eia.gov/maps/layer_info-m.cfm, Power Plants data set, last updated 7/7/2016]
The Commercial and Residential PV Systems layer shows 7,035 commercial and residential solar PV generation facilities. To protect the privacy of individual home and business owners, the icons are randomly placed within the zip code region of each address. Exact addresses for these locations are not shown, and when the map is enlarged, these icons disappear.
[Note: Data for the Commercial and Residential PV Systems Data layer was retrieved from a Right-to-Know Request from the Pennsylvania Department of Environmental Protection by the Mid-Atlantic Renewable Energy Association (MAREA) of all the solar PV systems that received Pennsylvania Sunshine Grant money through the closure of that program in December 2013. As of June 28, 2016, there were 8,518 solar PV systems in Pennsylvania registered with PJM, so almost 1,500 of these systems do not appear on the map because their locations are not available.]
State and House Districts layers outline Pennsylvania state legislative districts.
More about the map
The Clean Energy Map of PA includes companies from E2’s jobs report survey. The map also includes data from Conservation Service Providers registered with the Pennsylvania Public Utility Commission to provide services under Act 129, as well as data obtained via internet searches of clean energy companies throughout the state.
The map is a dynamic, “living” tool. It will continually capture and update information on companies helping expand Pennsylvania’s clean energy economy. Every month, we add clean energy companies to the map. (However, it is important to note that we do not endorse or vet companies that choose to be included in the map.)
To better understand how clean energy is creating jobs in the Keystone State and to examine what policies are needed now to support future job growth, Clean Jobs Pennsylvania analyzes the size and scope of the state’s clean energy economy. Relying on databases and survey data from Pennsylvania employers, this comprehensive report found that the clean energy sector in Pennsylvania in 2015 employed more than 66,000 workers at 5,900 businesses and establishments.
Overall Clean Energy Jobs
The clean energy industry—which in this report includes energy efficiency, renewable energy, alternative transportation and greenhouse gas (GHG) management and accounting—is a source of good jobs for tens of thousands of Pennsylvanians.
In 2015, Pennsylvania’s clean energy industry supported 66,021 workers at 5,900 businesses and establishments according to E2 and the Keystone Energy Efficiency Alliance’s (KEEA) 2016 Clean Jobs Pennsylvania report. Four out of five of these jobs are in energy efficiency. To grow the clean energy sector even more, state and federal lawmakers can strengthen policies like Act 129, the state’s renewable energy law, and implement the Clean Power Plan in a way that prioritizes renewables and energy efficiency.
Energy efficiency industries led the clean energy sector in job growth last year, increasing from 37,000 jobs to 53,000 jobs. These gains in energy efficiency employment helped boost the overall number of clean energy jobs in Pennsylvania by more than 8,700 workers between 2014-2015, despite job declines in clean fuels and other areas. Renewable energy jobs increased slightly to more than 8,800 jobs, reflecting growth in the wind, solar, and low-impact hydro-electric industries. The bioenergy industry shed about 2,000 jobs, which mirrors a national slowdown trend in the technology. Companies in the state are bullish on the industry’s future. More than half project hiring more employees in 2016.
This represents about 1 percent of total state employment. It also represents a 15 percent increase over the number of clean energy jobs in the state in 2014, nearly doubling the predicted growth rate E2 identified in our previous Clean Jobs Pennsylvania report. Clean energy businesses across the state say they anticipate growth to continue. More than half of the businesses surveyed expect to add jobs in the upcoming year, with only 3 percent expecting to cut jobs.
DOWNLOAD
The complete report is available for download at this link or by clicking the cover of the report above.
Solar energy is at a turning point in Massachusetts. While its benefits and popularity are undeniable, continued growth is in jeopardy. Solar development is completely stalled in half of Massachusetts and could grind to a halt throughout the state without supportive policies.
A comprehensive analysis of clean energy jobs in New York
E2 and our partners recently released Clean Jobs New York, a comprehensive report showing that more than 85,000 people work in the clean energy sector in New York at more than 7,500 business establishments.
The report is available here and you can also search for clean energy jobs in your home county with this dynamic, searchable dashboard.
The press release for the report is here,the press release for the New Yorkers for Clean Power campaign is available here, and press coverage of the report is available here.
By looking at the size and scope of the state’s clean energy economy, Clean Jobs New York helps stakeholders better understand how clean energy is creating jobs — and what policies are needed now to support further gains in the future.
A few of the report’s key findings include:
Clean energy employs 85,197 people at 7,500 business establishments statewide. Energy efficiency is the largest industry in the sector, employing four out of five clean energy workers in New York.
Clean energy businesses anticipate growing more than 6 percent this year. That’s more than double the growth rate of the entire U.S. economy in 2015.
Clean energy knows no politics. Clean energy jobs are growing in legislative and congressional districts across the state. With the right policies from Albany and Washington, D.C., even more jobs can be created all across New York.
More than 2.5 million Americans work in clean energy nationwide, according to a comprehensive analysis of U.S. clean energy jobs. Energy efficiency, renewable energy and advanced vehicles were the clean energy industries with the most workers.
Clean energy developers announced more than 50 new utility-scale generation and storage projects totaling over 12 gigawatts (GW) and $18 billion in investment during the first quarter of 2026, according to E2’s latest Clean Economy Works analysis tracking c...
“Amid soaring electricity costs and tens of billions in clean energy projects getting cancelled and delayed across the country, this is a modest – but smart – step back in the right direction."
April 24 2026
Donate Today
Make a donation to help E2 advance policies that are good for the economy and good for the environment. Your donation is 100% tax-deductible from our partner, the NRDC.
Please contact E2 Membership Director Ying Li at [email protected] or 212-727-4437 for stock and wire transfer instructions.
For stocks, alert us to the transfer and provide the name of the stock and the number of shares being donated. This will help us track your donation internally and enable NRDC to provide an accurate gift receipt in a timely fashion.
Donations to E2 go directly to NRDC, a 501(c)3, and are fully tax-deductible (Federal Tax ID: 13-2654926). E2 collects no funds. NRDC provides full-time staffing dedicated to E2, as well as administrative, communications, legislative and analyst/policy support for the work of E2.
By Check
Make personal, Foundation or Donor Advised Fund checks payable to NRDC (indicate your donation is for E2 Membership to expedite processing) and send to:
Natural Resources Defense Council
Attn: Gift Processing
40 West 20th Street, 11th floor
New York, NY 10011