Clean Jobs Midwest 2025
 Summary
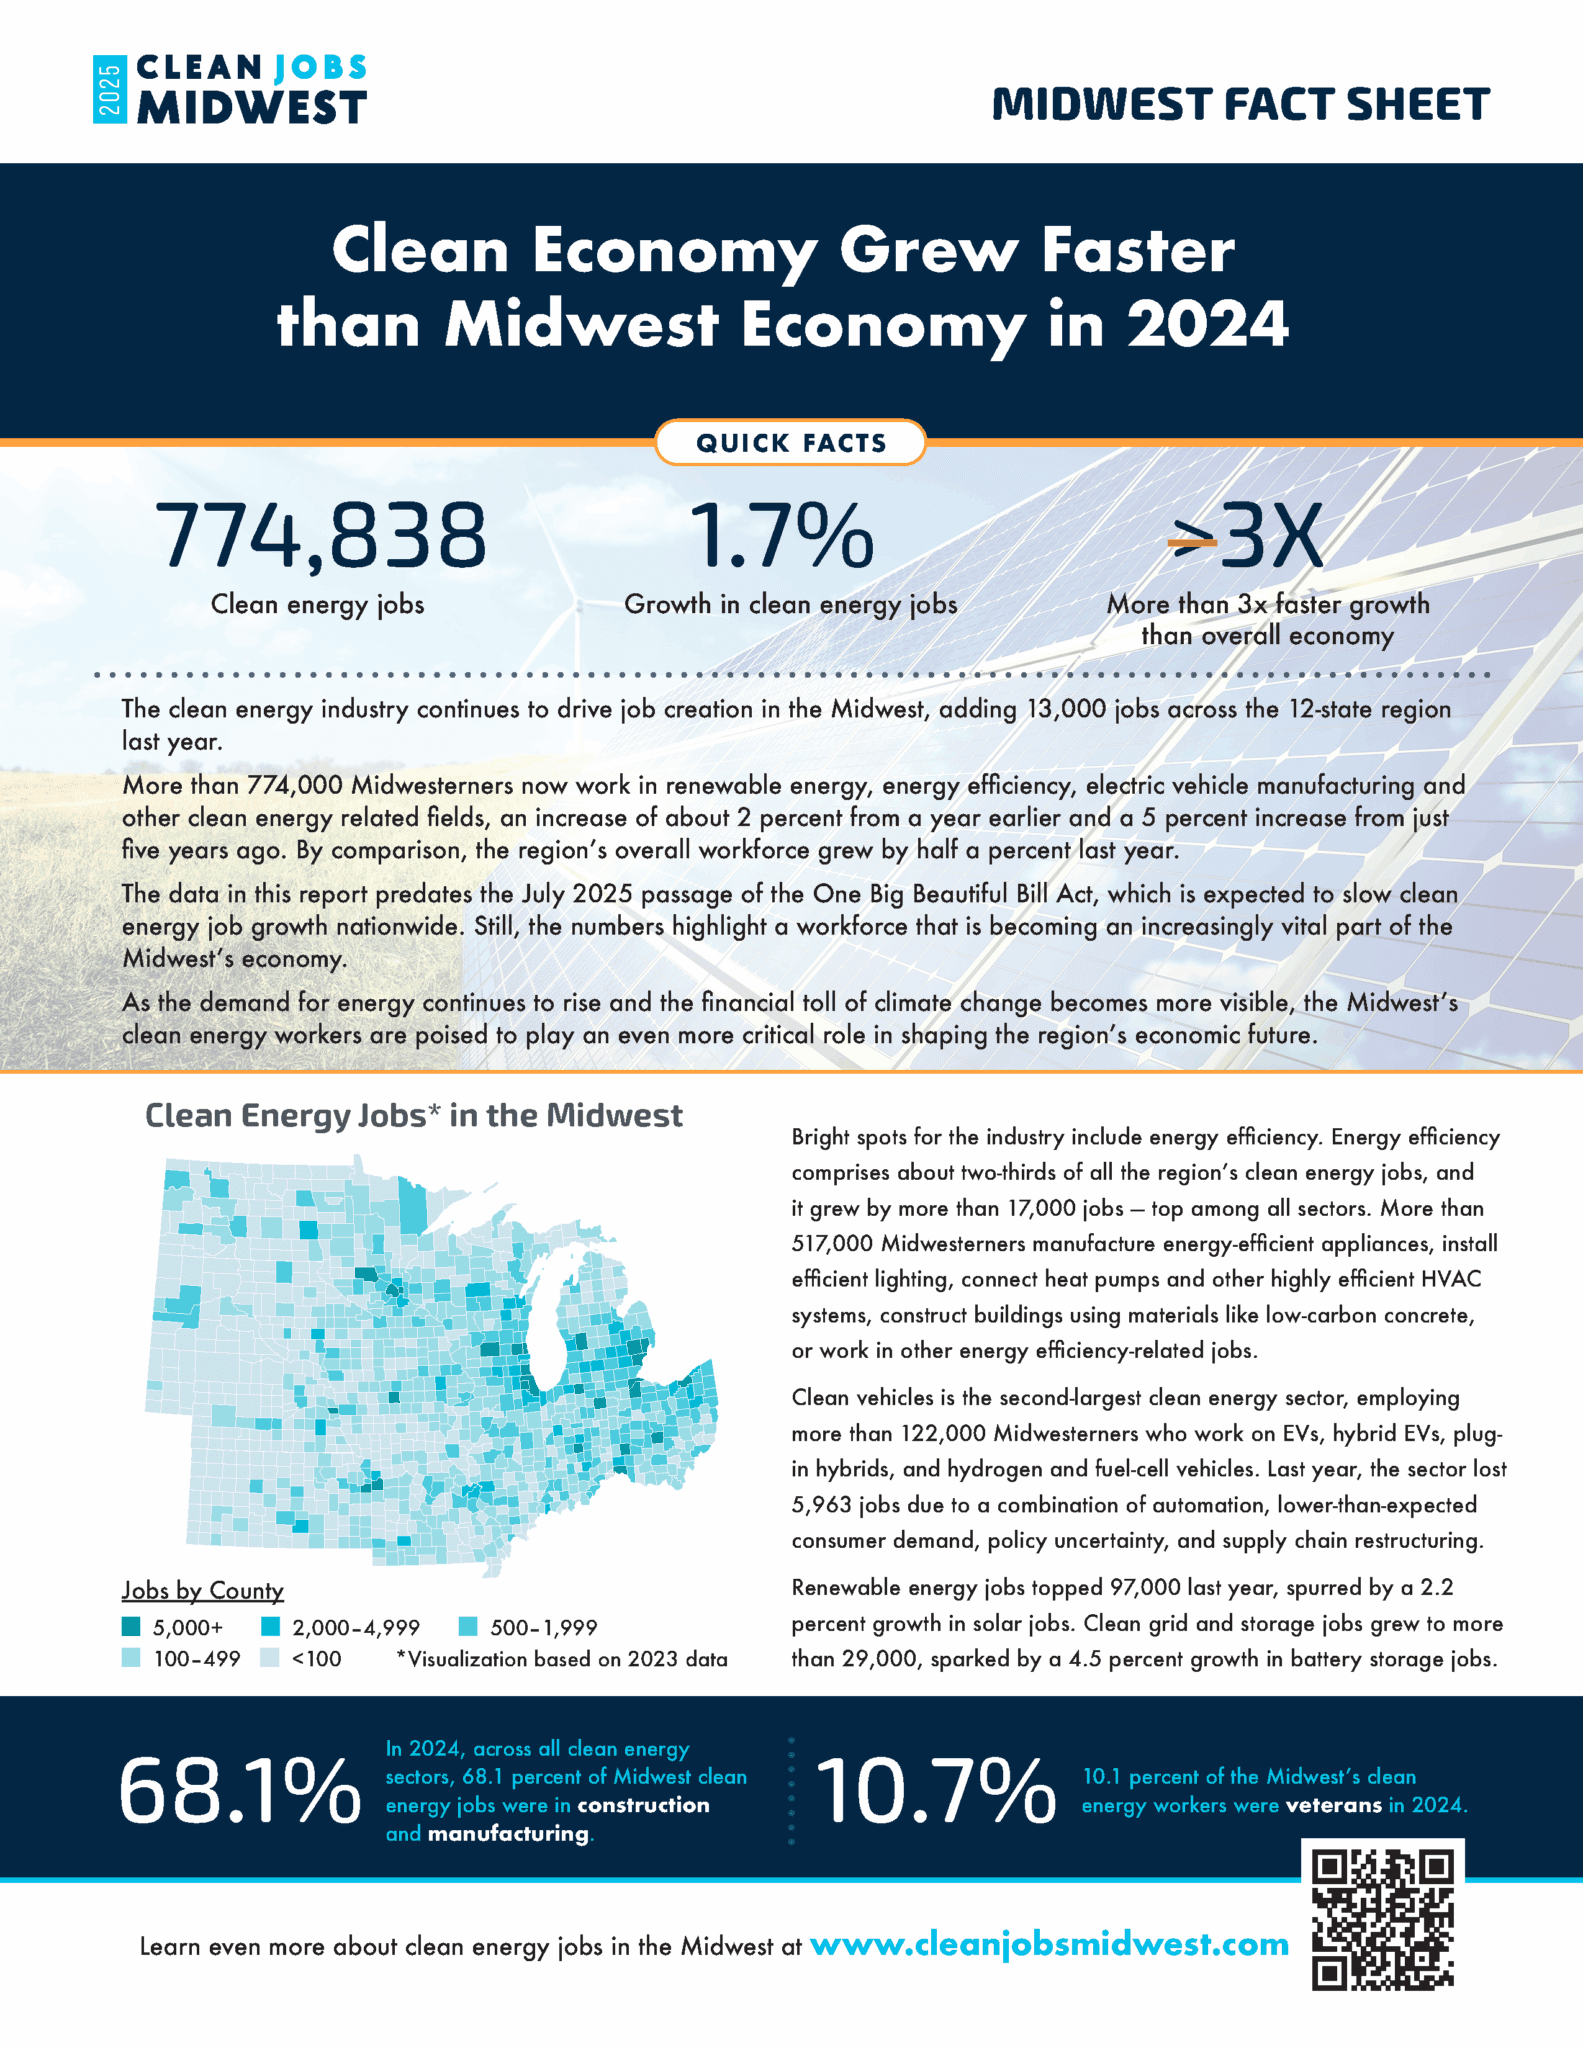
The clean energy industry continues to drive job creation in the Midwest, adding 13,000 jobs across the 12-state region last year.
More than 774,000 Midwesterners now work in renewable energy, energy efficiency, electric vehicle manufacturing and other clean energy related fields, an increase of about 2 percent from a year earlier and a 5 percent increase from just five years ago. By comparison, the region’s overall workforce grew by half a percent last year.
The data in this report predates the July 2025 passage of the One Big Beautiful Bill Act, which is expected to slow clean energy job growth nationwide. Still, the numbers highlight a workforce that is becoming an increasingly vital part of the Midwest’s economy.
As the demand for energy continues to rise and the financial toll of climate change becomes more visible, the Midwest’s clean energy workers are poised to play an even more critical role in shaping the region’s economic future.
BY THE NUMBERS
- Energy Efficiency – 517,316 jobs
- Clean Vehicles – 122,296
- Renewable Energy – 97,070
- Grid & Storage – 29,711
- Clean Fuels – 8,485
- Total Clean Energy – 774,838 jobs
SECTOR FINDINGS
Bright spots for the industry include energy efficiency. Energy efficiency comprises about two-thirds of all the region’s clean energy jobs, and it grew by more than 17,000 jobs — top among all sectors. More than 517,000 Midwesterners manufacture energy-efficient appliances, install efficient lighting, connect heat pumps and other highly efficient HVAC systems, construct buildings using materials like low-carbon concrete, or work in other energy efficiency-related jobs.
Clean vehicles is the second-largest clean energy sector, employing more than 122,000 Midwesterners who work on EVs, hybrid EVs, plug-in hybrids, and hydrogen and fuel-cell vehicles. Last year, the sector lost 5,963 jobs due to a combination of automation, lower-than-expected consumer demand, policy uncertainty, and supply chain restructuring.
Renewable energy jobs topped 97,000 last year, spurred by a 2.2 percent growth in solar jobs. Clean grid and storage jobs grew to more than 29,000, sparked by a 4.5 percent growth in battery storage jobs.
DOWNLOAD
The complete report along with interactive breakdowns for all states is available at this link.
PREVIOUS CLEAN JOBS MIDWEST REPORTS
0
total clean energy jobs
Quick Facts
0
new jobs
0
faster growth than overall economy