Clean Jobs Pennsylvania 2019
Clean Energy Driving Pennsylvania’s Job Growth
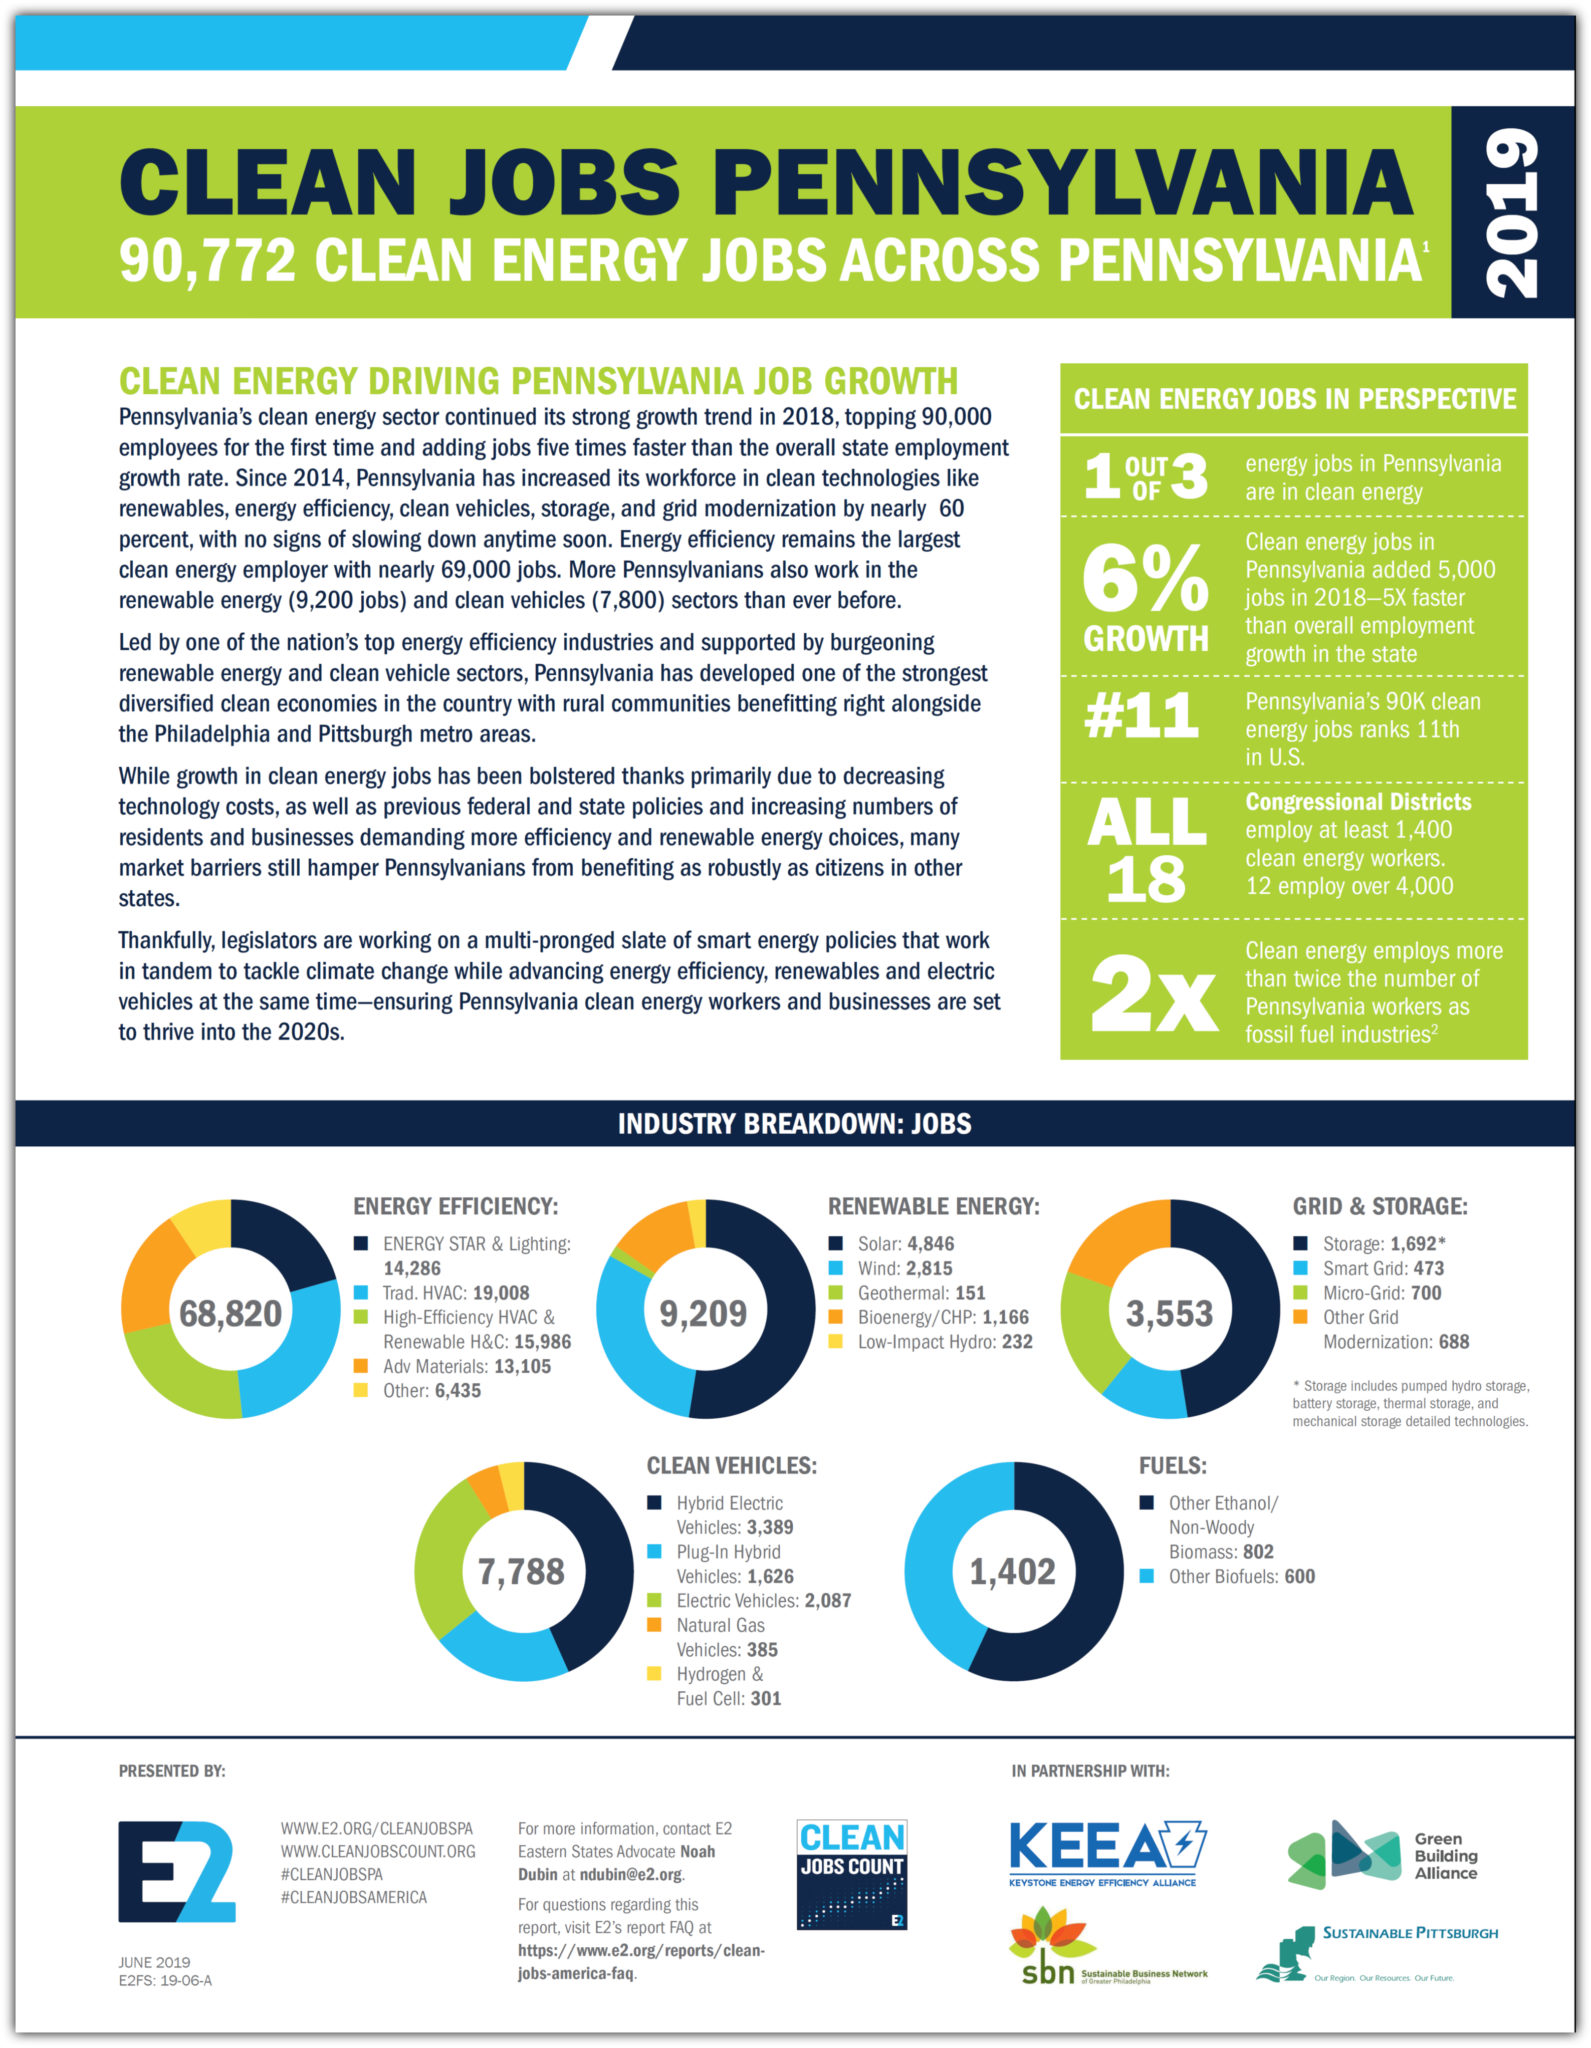 Pennsylvania’s clean energy sector continued its strong growth trend in 2018, topping 90,000 employees for the first time and adding jobs five times faster than the overall state employment growth rate.
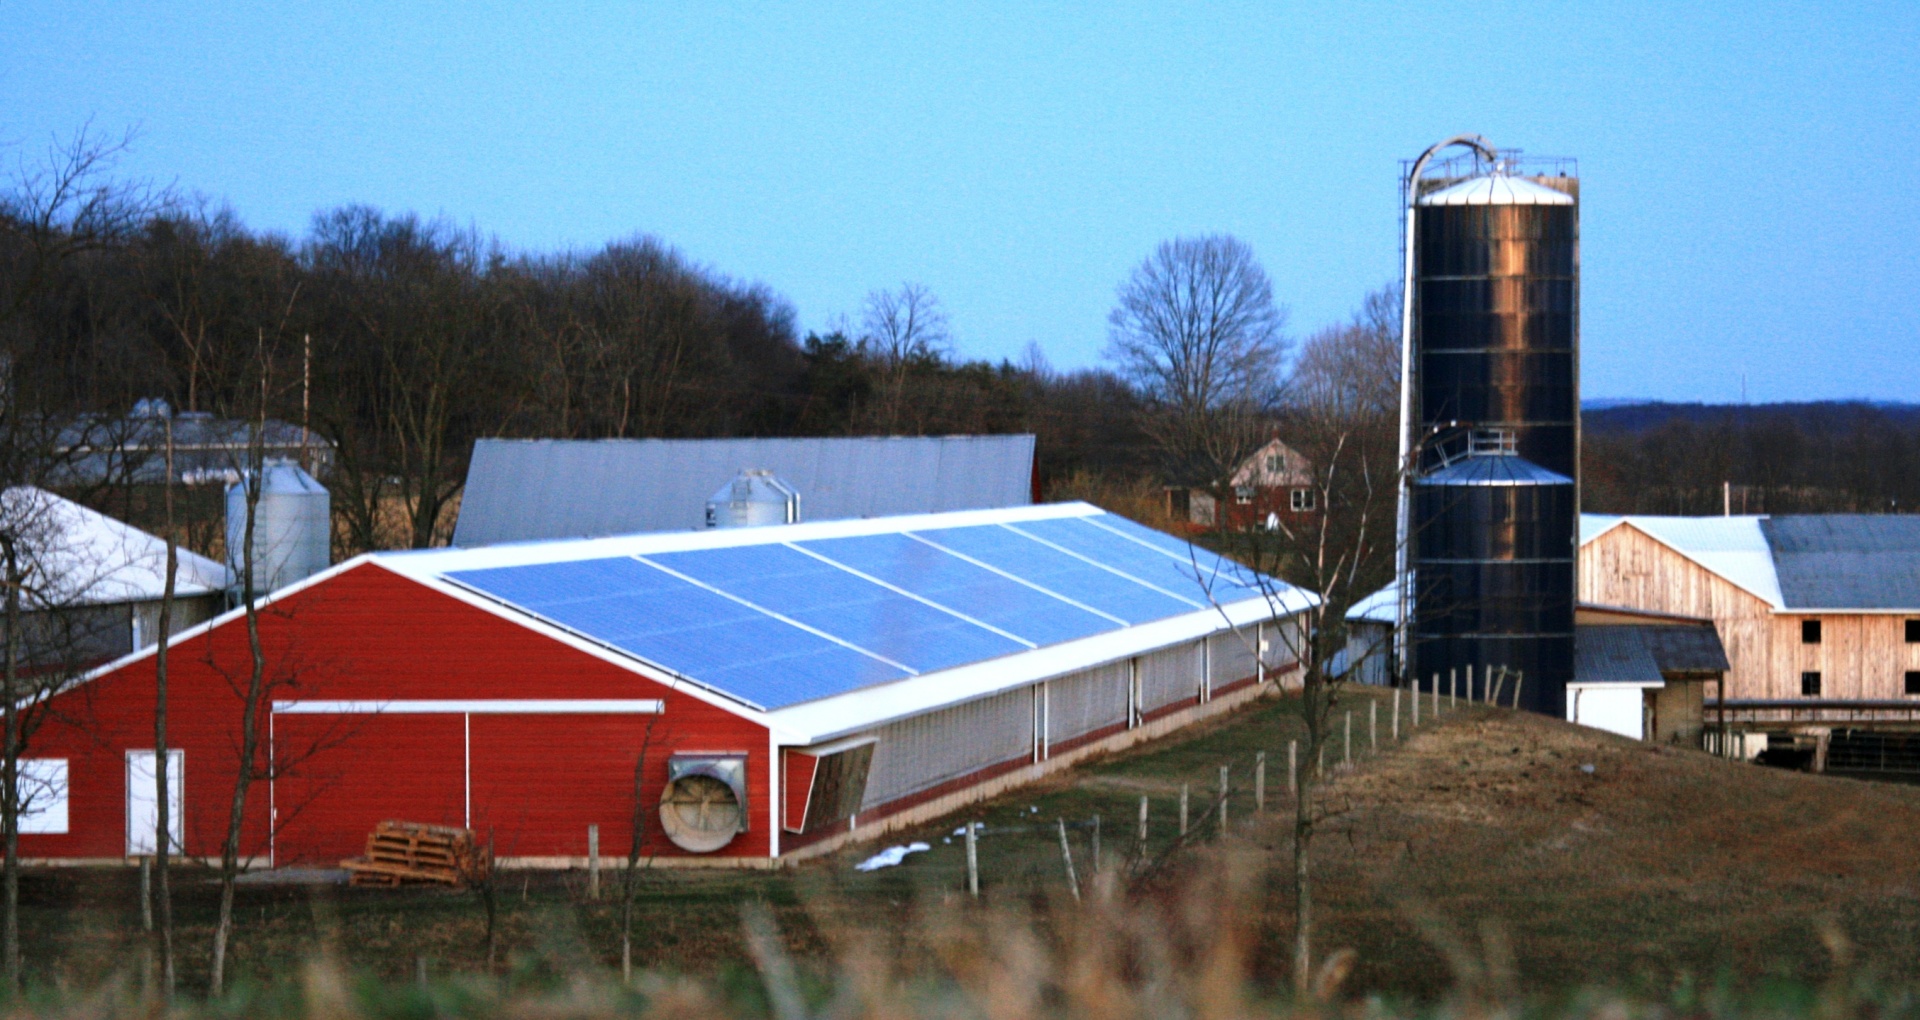
Led by one of the nation’s top energy efficiency industries and supported by burgeoning renewable energy and clean vehicle sectors, Pennsylvania has developed one of the strongest diversified clean economies in the country with rural communities benefiting right alongside the Philadelphia and Pittsburgh metro areas.
Since 2014, Pennsylvania has increased its workforce in clean technologies like renewables, energy efficiency, clean vehicles, storage, and grid modernization by nearly 60 percent – employing now twice as many workers as the state’s entire fossil fuel industry. This recent growth over the past several years has put Pennsylvania within 4,400 jobs of overtaking Virginia as the No. 10 state in the U.S. for clean energy employment.
According to Clean Jobs Pennsylvania 2019 (downloadable PDF), energy efficiency remains the largest clean energy employer with nearly 69,000 jobs. More Pennsylvanians also work in the renewable energy (9,200 jobs) and clean vehicles (7,800) sectors than ever before.
Pennsylvania JOB SECTOR TOPLINES
- Energy Efficiency – 68,820 jobs
- Renewable Energy – 9,209 jobs
- Clean Vehicles – 7,788 jobs
- Solar Energy – 4,846 jobs
- Wind Energy – 2,815 jobs
- Energy Storage – 1,692 jobs
- Grid Modernization – 1,861 jobs
- ALL Clean Energy Sectors – 90,772 jobs
OTHER HIGHLIGHTS
- Construction (45.9%) and manufacturing (19.8%) make up the majority of clean energy jobs.
- Since 2014, Pennsylvania’s clean energy workforce has grown from 57,000 to over 90,000
- 3,553 Pennsylvanians now work in grid modernization (1,861) and energy storage (1,692)
- 11,000 clean energy jobs in the state’s rural areas
- Clean energy jobs now account for one out of every three energy jobs in Pennsylvania and employs more than twice the number of workers (90,772) as Pennsylvania’s entire fossil fuel industry (43,306).
- 44 percent of Pennsylvania’s clean energy workforce is located outside the Pittsburgh and Pennsylvania metro areas
- Two out of every three Pennsylvania clean energy workers is employed by a businesses with fewer than 20 employees
- Electric power generation jobs using fossil fuels (4,935) employed 4,274 less workers than renewable energy generation jobs (9,209)
- 9.7 percent of Pennsylvanians employed in clean energy are veterans, compared to the national average (6%)
- 18 of Pennsylvania’s congressional districts are home to at least 1,400 clean jobs with 15 supporting over 3,000
- While fourth overall, Lehigh County led the state in clean jobs per capita with over 25 clean jobs per 1,000 employable residents
- 19 of Pennsylvania’s 67 counties employ at least 1,000 clean energy workers
Looking for More Info?
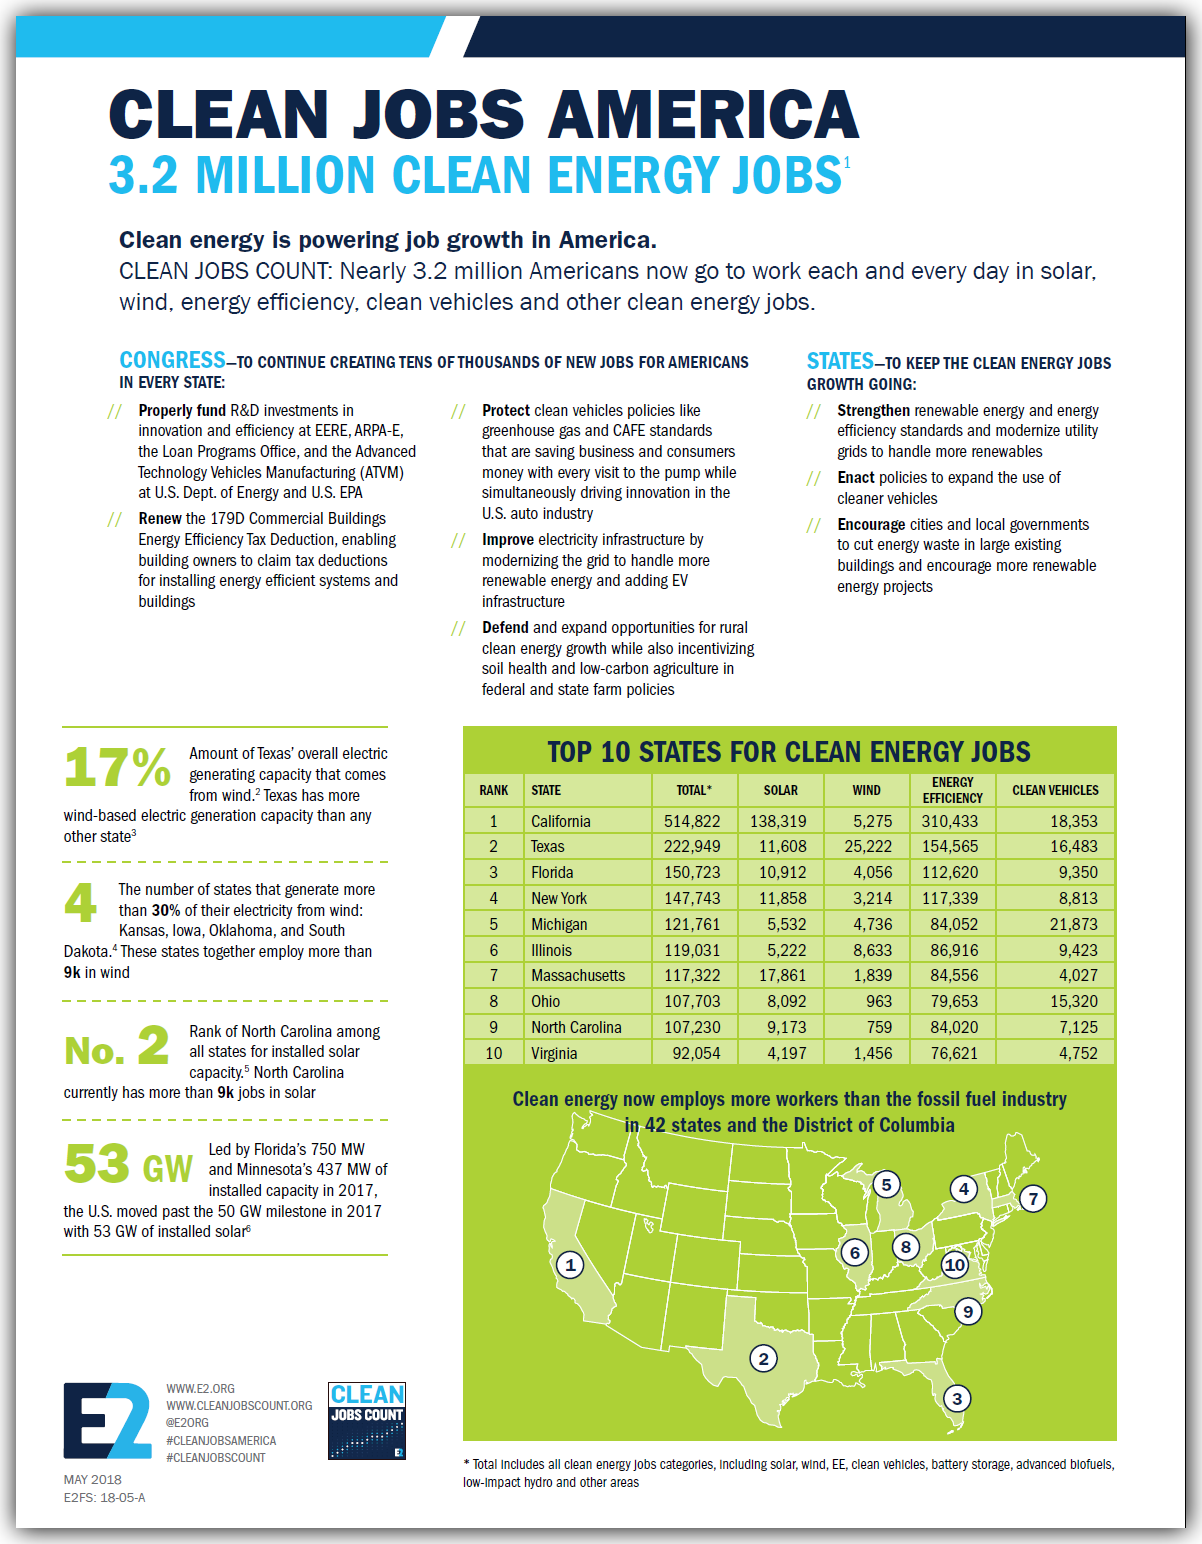
This report follows E2’s Clean Jobs America analysis which found the clean energy jobs account for nearly 3.3 million jobs across all 50 states and the District of Columbia. Both reports expand on data from the U.S. Energy and Employment Report (USEER) produced by the Energy Futures Initiative (EFI) in partnership with the National Association of State Energy Officials (NASEO), using data collected and analyzed by the BW Research Partnership. E2 is a partner on the USEER, the fourth installment of the energy survey first released by the Department of Energy in 2016. Clean energy jobs have grown every year since the first report was released in 2016.
If you are looking for additional insight into E2’s Clean Jobs Pennsylvania 2019 or our other Clean Jobs America reports, visit e2.org/reports. You can also contact E2 Communications Director Michael Timberlake ([email protected]). An FAQ is also available here to answer any questions.
DOWNLOAD
The complete report is available for download at this link.
OTHER CLEAN JOBS REPORTS
Clean Jobs Pennsylvania is only one in a series of state and industry reports produced by E2 and our partners.
- Clean Jobs America 2019 | Nearly 3.3 Million Clean Energy Jobs
- Clean Jobs Midwest 2019 |Region added more than 28,000 clean energy jobs in 2018
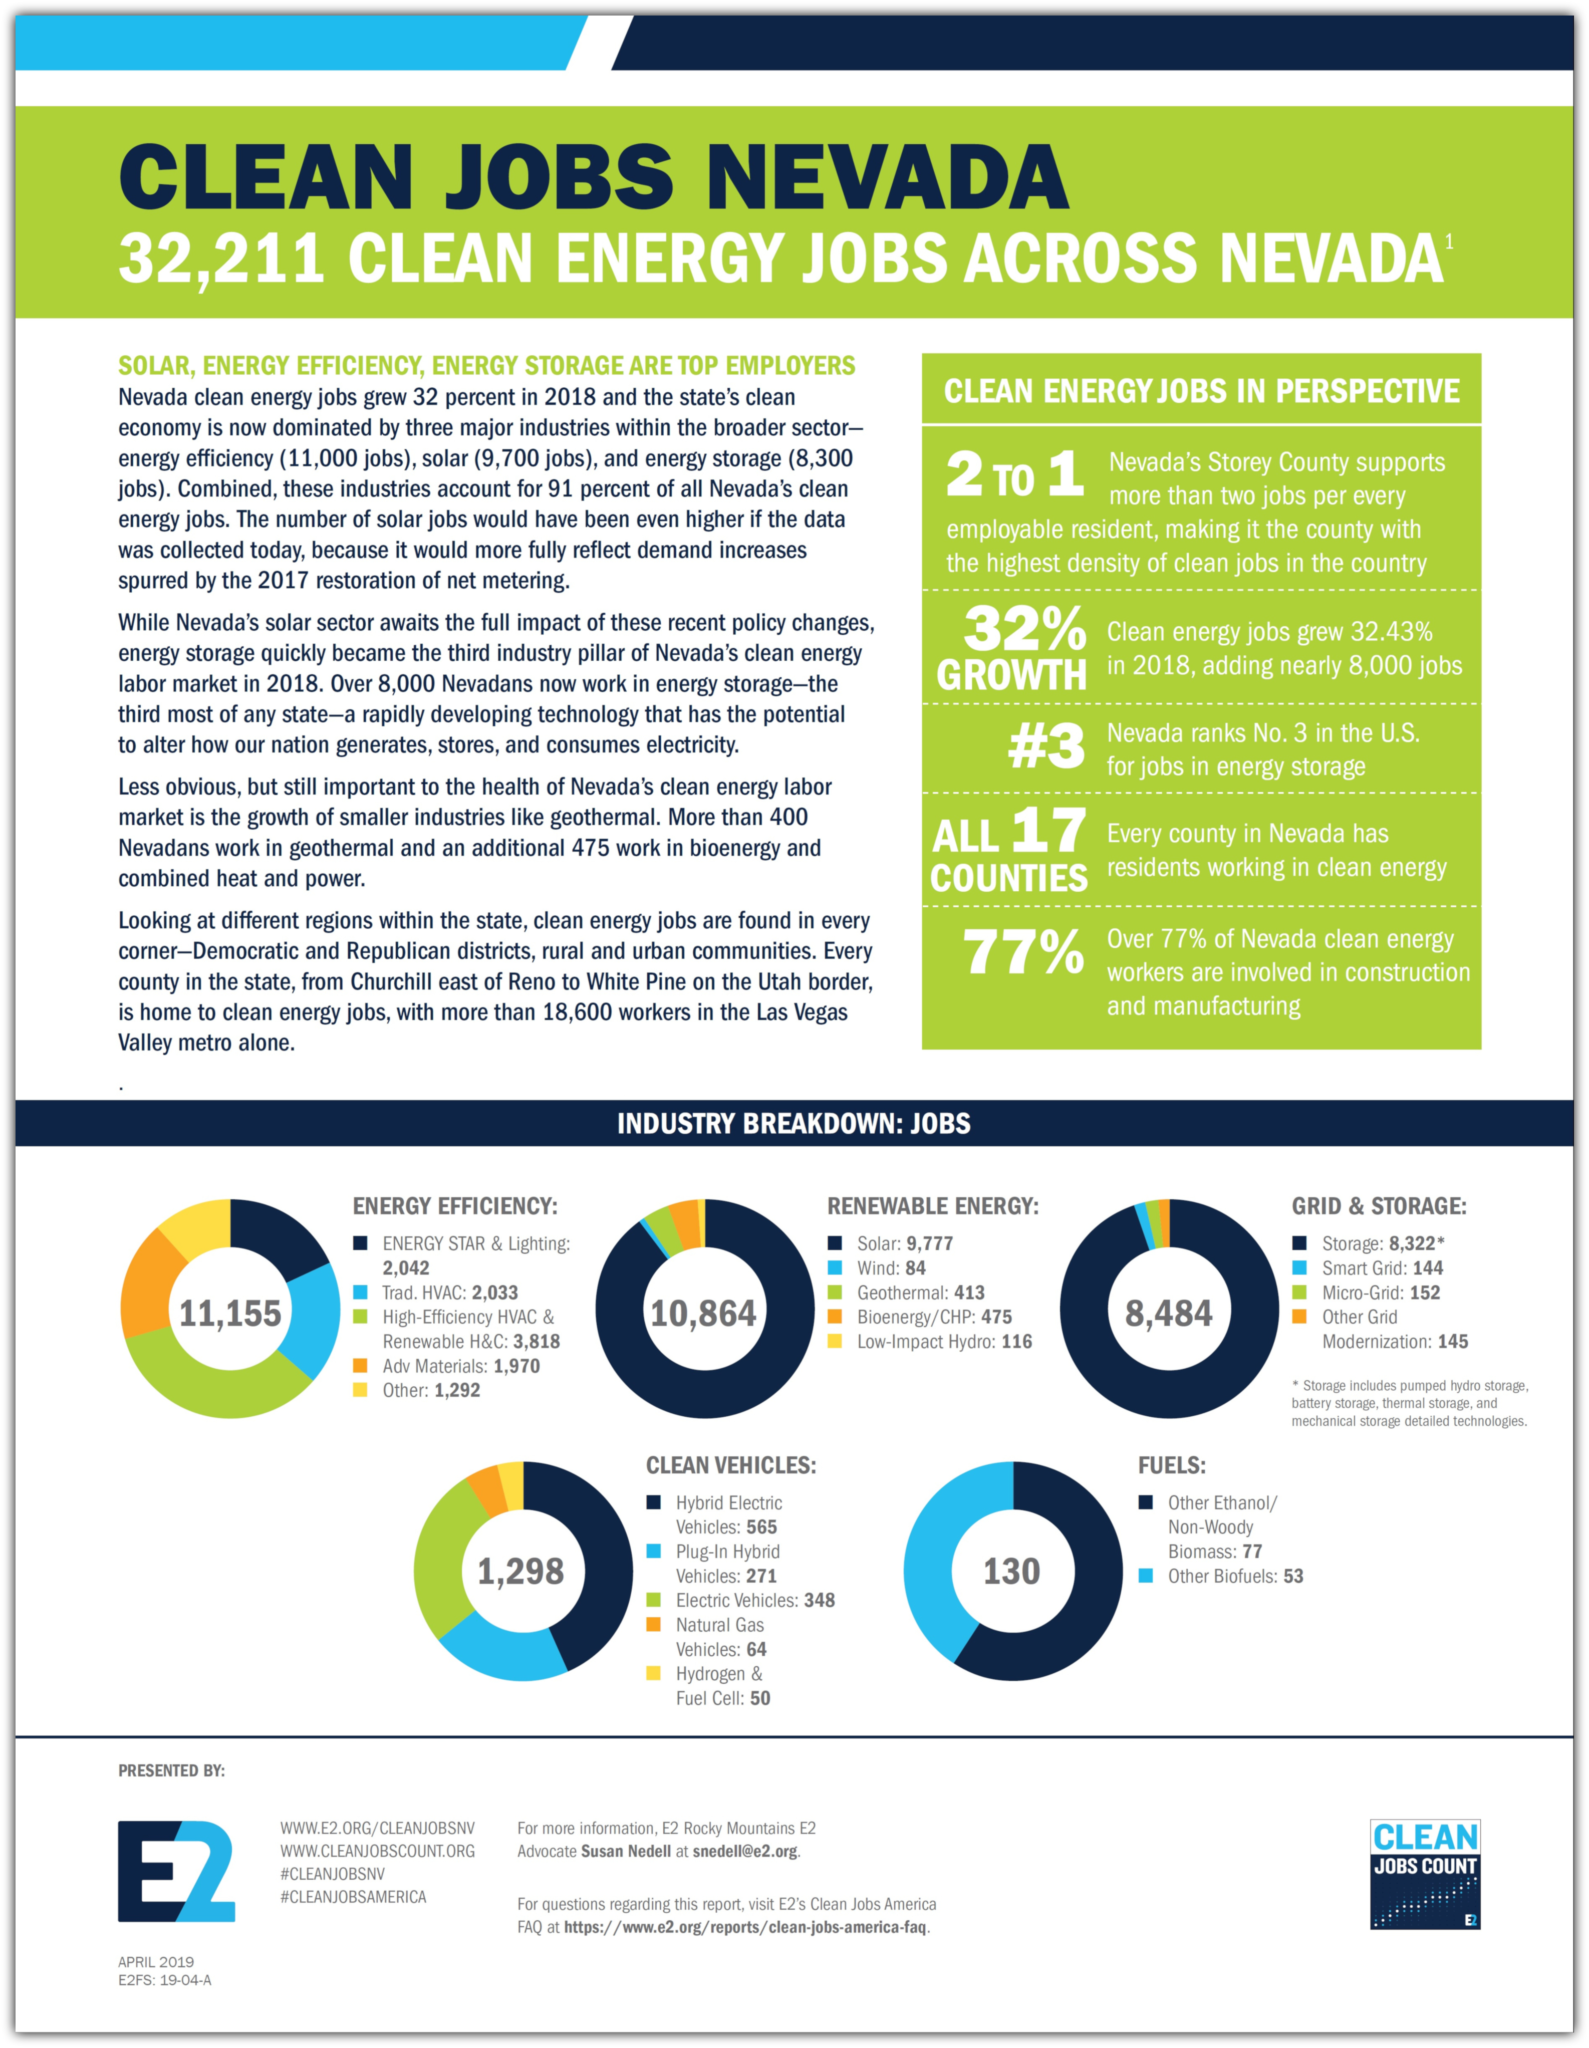
- Clean Jobs Nevada 2019 | 32,211 Clean Energy Jobs Across Nevada
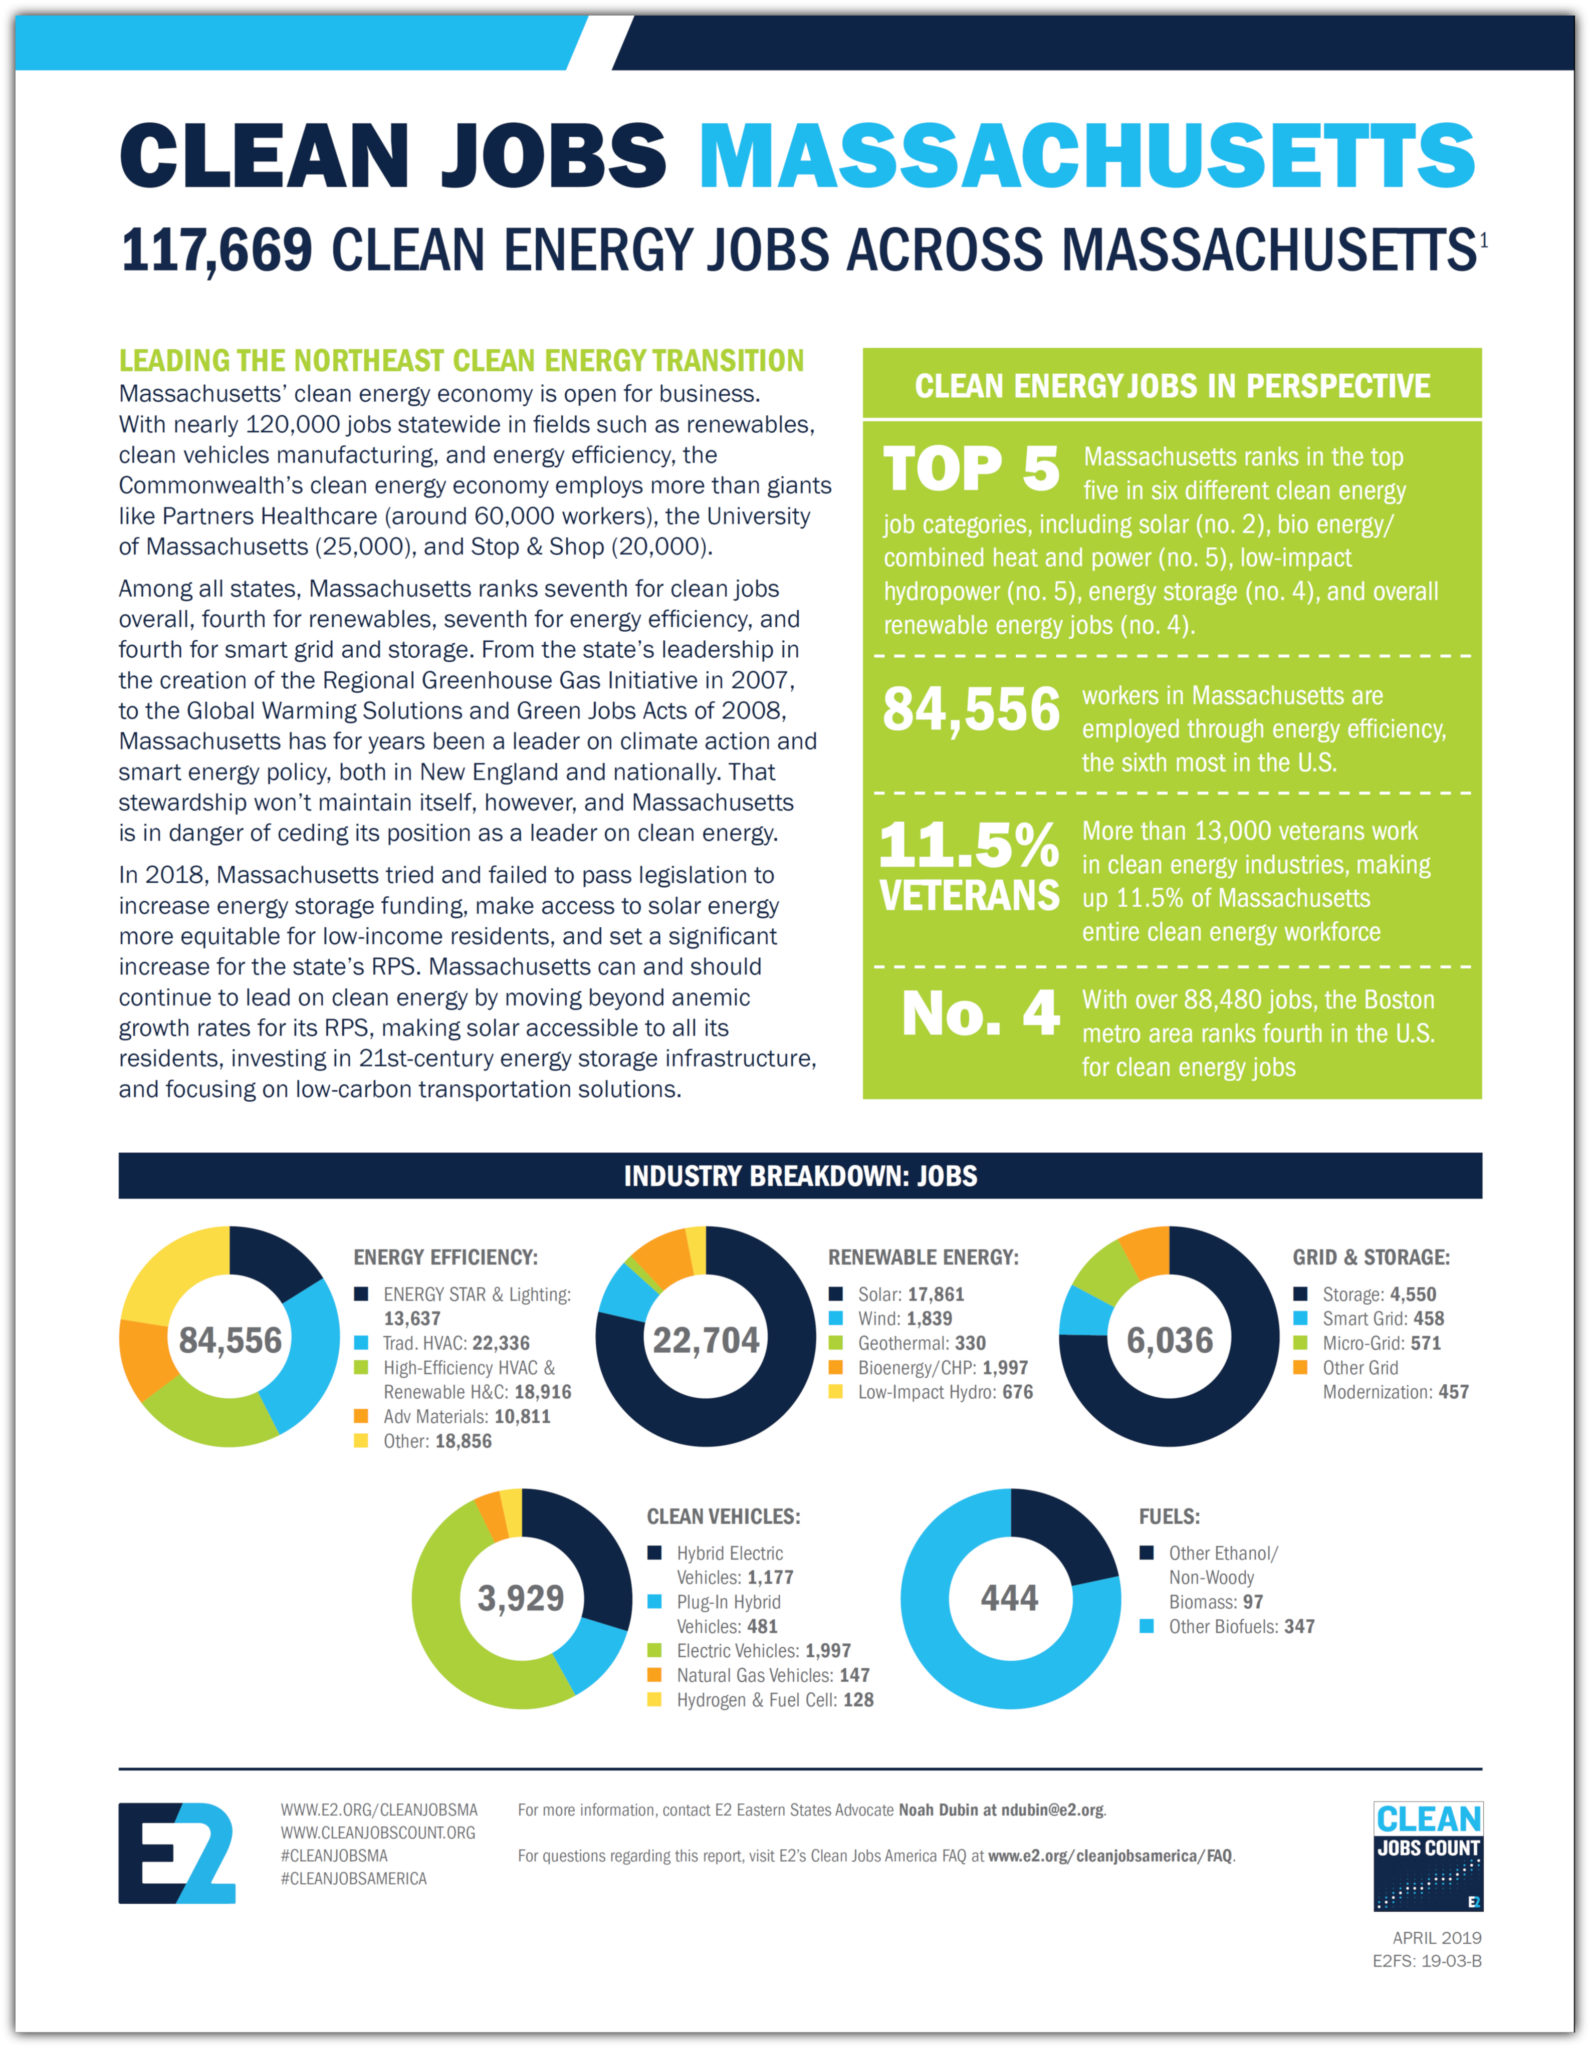
- Clean Jobs Massachusetts 2019 | 117,669 Clean Energy Jobs Across Massachusetts
- Clean Jobs New York 2019 | 148,453 Clean Energy Jobs Across Empire State
- Clean Jobs New Jersey 2019 |51,852 Clean Energy Jobs Across New Jersey
- Energy Efficiency Jobs in America 2018 | 2.25 Million Americans Work in Energy Efficiency
- Clean Jobs Cities 2018 | America’s Top Cities for Clean Energy Jobs
- Clean Jobs California 2018 | Over 500K Californians Working in Clean Energy
- Clean Jobs Oregon 2018 | 55,179 Clean Energy Jobs Across Oregon
- Clean Jobs Washington 2018 | 82,859 clean energy jobs across Washington State
- Clean Jobs Colorado 2018 | 57,591 Clean Energy Jobs Across Colorado
- Clean Jobs Pennsylvania 2018 | Powering Over 86K Jobs in the Keystone State