E2 awards Boulder entrepreneur $20,000 grant

BOULDER — Environmental Entrepreneurs, an environmental advocacy organization known as E2, announced this week participants of the 2020 E2 1 Hotels Fellowship program, which includes Jock Gilchrist of Boulder. Gilchrist, who will receive a $20,000 grant as part of the program, is building a “multimedia campaign to make the business case for implementing regenerative agriculture, […]

$20,000 Awarded to 10 Emerging Clean Energy Leaders Across U.S.

2020 Fellows represent 8 states across 5 regions SAN FRANCISCO – National business group E2 (Environmental Entrepreneurs) and sustainability-driven hotel brand 1 Hotels announced today the 2020 1 Hotels Fellowship class at E2. This is the third-year of the annual fellowship, which awards ten young U.S. business leaders $20,000 each to execute projects that advance […]

GOP Edges Gingerly Toward Climate Plan After Sowing Doubts

“From our perspective the climate crisis is huge and its going to need Democrats and Republicans alike working toward solving it,” said Sandra Purohit, director of federal advocacy for E2, a group of environmental business leaders that is partnering with the Natural Resources Defense Council. “We see these as building blocks, its not the whole […]

Daybreak: A California carbon farming market

CDFA considers a carbon farming market CDFA measures the success of its Healthy Soils incentives program in part by how much carbon is sequestered in the soil. Now the department is considering a proposal to monetize that benefit through a carbon offset market, supplementing the incomes of those farmers. A coalition of businesses and organizations […]

2020 Not the Time to Put Clean Cars in Reverse

California’s fight against the Trump administration’s plans to roll back commonsense auto emissions and mileage standards may seem surprising to some who live beyond our state’s borders — but only if you ignore that the clean cars bill we passed in 2002 has been, simply put, a major success for California.

Clean Jobs Washington 2019

Date: December 18, 2019

Clean Energy Economy Integral to Evergreen State

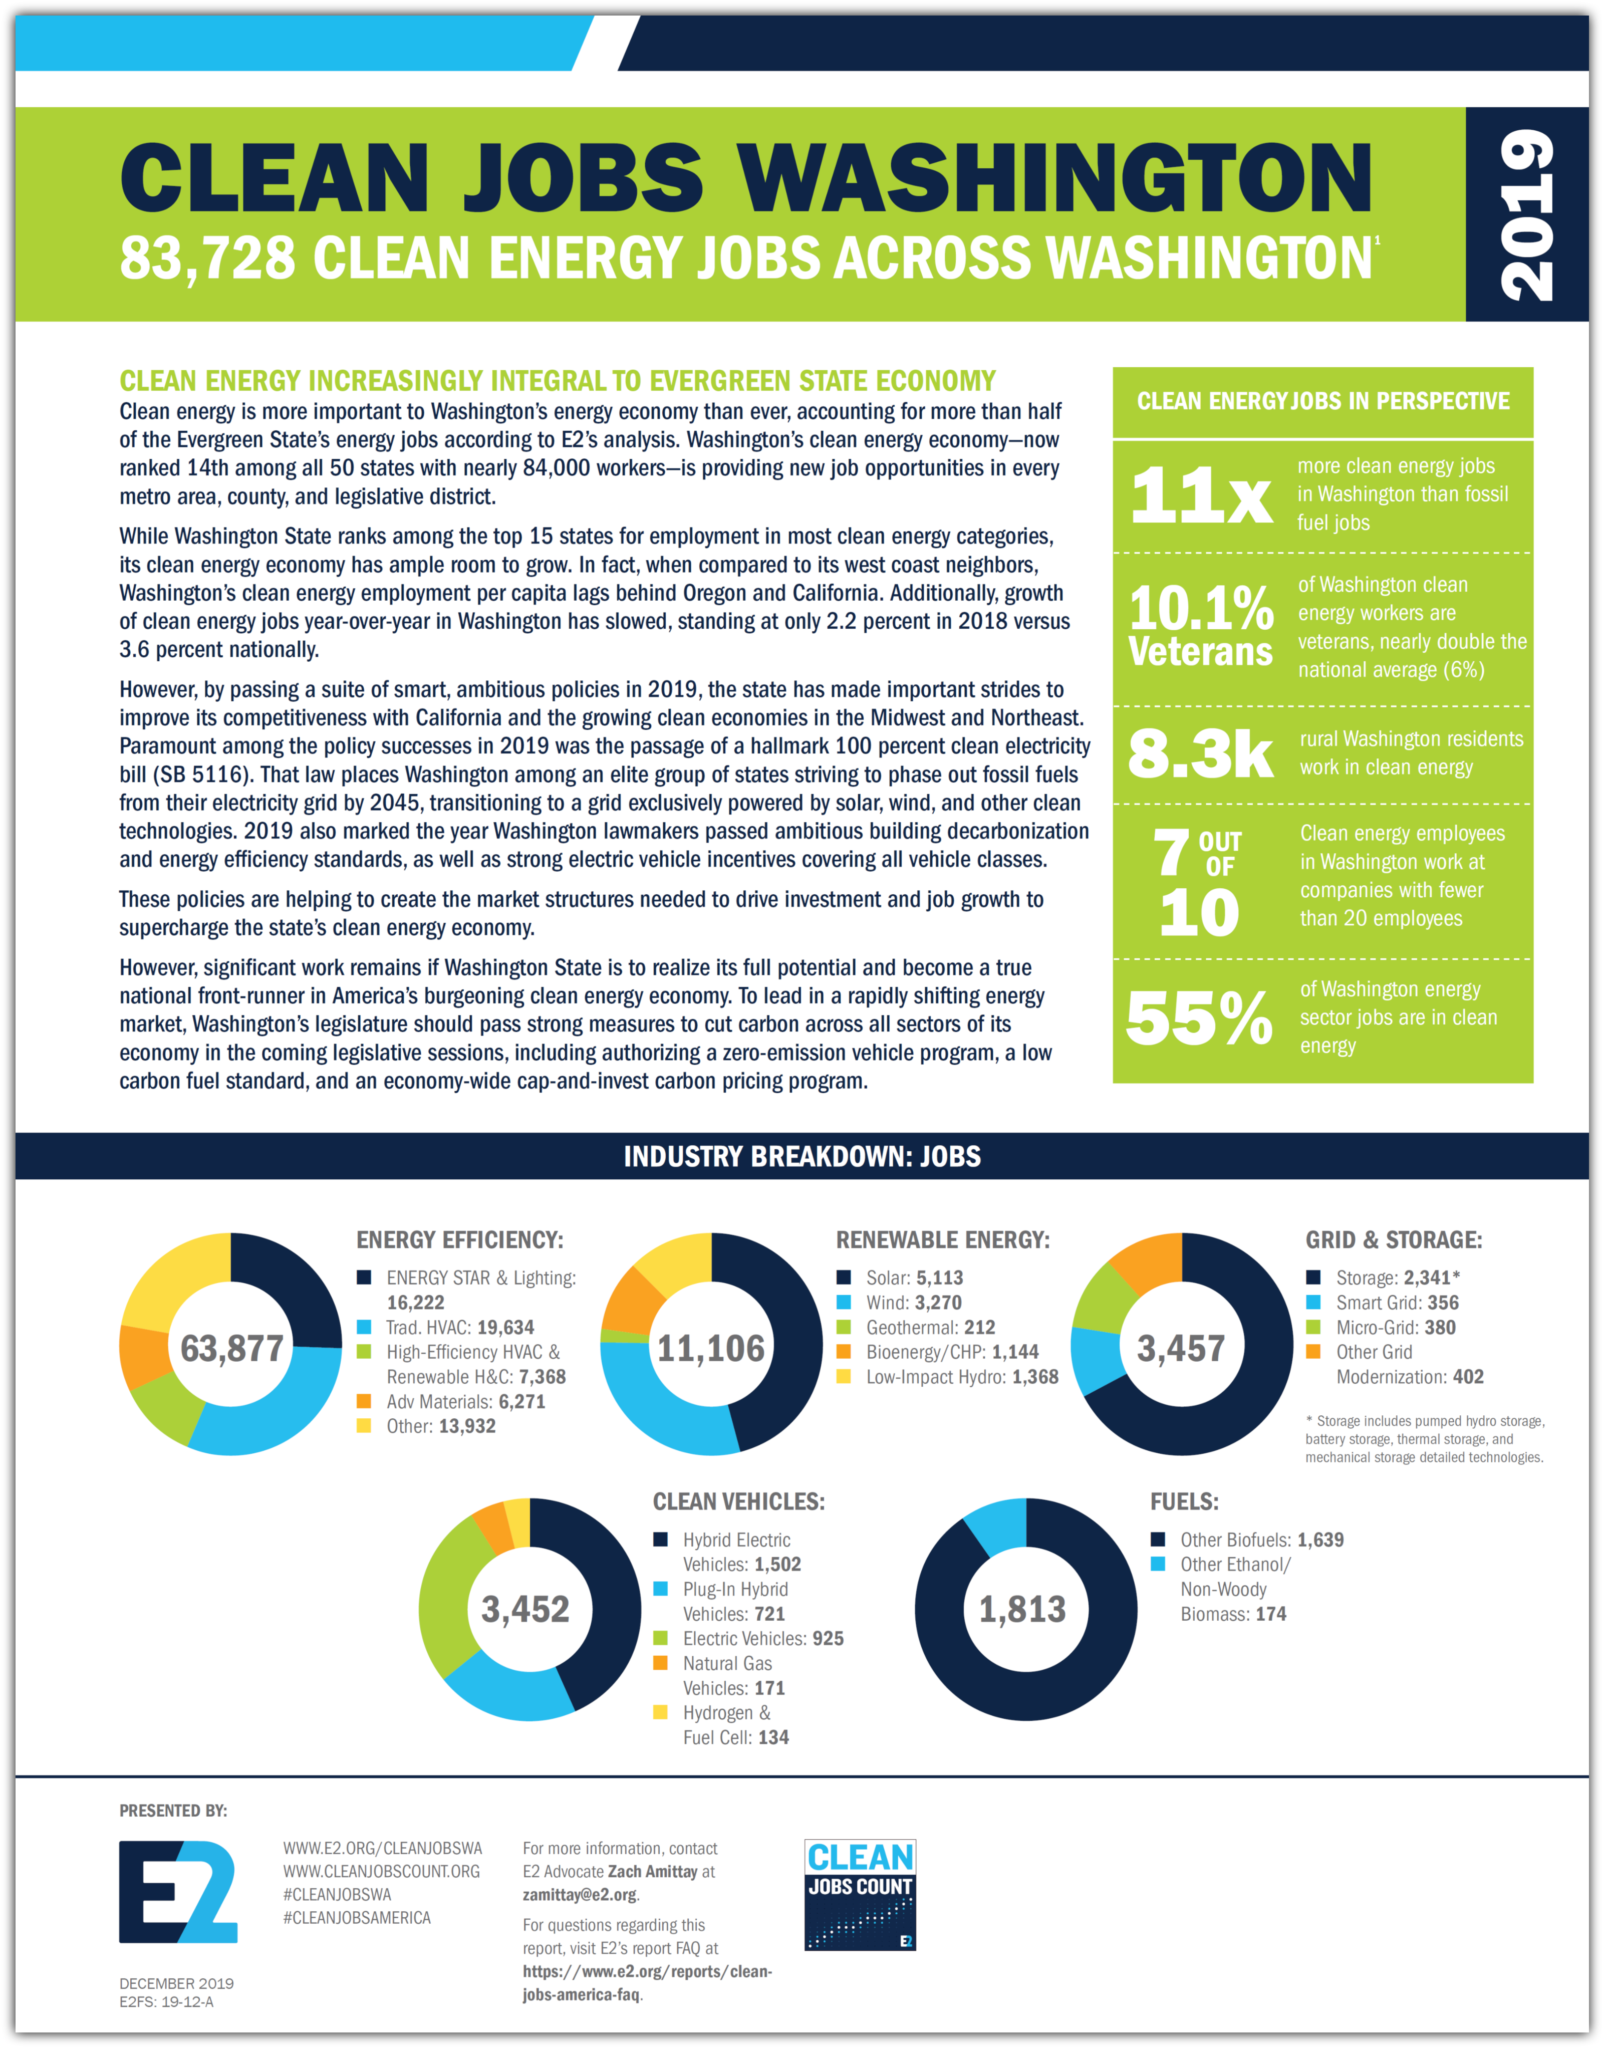
Clean energy is increasingly integral to Washington’s economic growth, as more than five out of every ten jobs in the Evergreen State’s energy economy are now in clean energy industries.  

Led by energy efficiency (63K) and renewable energy (11K), Washington’s clean energy economy—now ranked 14th among all 50 states with nearly 84,000 workers—is providing new job opportunities in every metro area, county, and legislative district.While Washington State ranks among the top 15 states for employment in most clean energy categories, its clean energy economy has ample room to grow. In fact, when compared to its west coast neighbors, Washington’s clean energy employment per capita lags behind Oregon and California.

However, by passing a suite of smart, ambitious policies in 2019, the state has made important strides to improve its competitiveness with California and the growing clean economies in the Midwest and Northeast. Paramount among the policy successes in 2019 was the passage of a hallmark 100 percent clean electricity bill (SB 5116).

But significant work remains if Washington State is to realize its full potential and become a true national front-runner in America’s burgeoning clean energy economy. To lead in a rapidly shifting energy market, Washington’s legislature should pass strong measures to cut carbon across all sectors of its economy in the coming legislative sessions, including authorizing a zero-emission vehicle program, a low carbon fuel standard, and an economy-wide cap-and-invest carbon pricing program.

A BIGGER PICTURE

This report focuses solely on the energy sector of the economy and does not include jobs in retail trade, repair services, water or waste management, and indirect employment or induced employment.

HOW WASHINGTON STACKS UP NATIONALLY

Washington ranks among the top 15 states for employment in 10 clean energy categories.

  • #11 Total Renewable energy
  • #13 Energy Efficiency
  • #6 Clean Storage
  • #11 Geothermal
  • #12 Bioenergy
  • #3 Small Hydropower
  • #10 Wind Energy
  • #2 Other Biofuels
  • #12 Total Transmission, Storage & Distribution
  • #14 Total Clean Energy

WASHINGTON CLEAN JOB SECTOR TOPLINES

  • Energy Efficiency – 63,877 jobs
  • Renewable Energy – 11,106 jobs
  • Solar Energy – 5,113 jobs
  • Clean Vehicles – 3,452 jobs
  • Wind Energy – 3,270 jobs
  • Energy Storage – 2,341 jobs
  • Clean Fuels – 1,813 jobs
  • Grid Modernization – 1,138 jobs
  • ALL Clean Energy Sectors – 83,728 jobs

HIGHLIGHTS

According to Clean Jobs Washington 2019:

  • Seven out of every ten (69.9%) clean energy workers are employed by businesses with fewer than 20 total employees.
  • Construction (64.3%) accounts for the majority of clean energy jobs.
  • If counted as a single metro area, Washington’s rural areas rank second in the state for clean energy jobs, behind only the Seattle-Tacoma-Bellevue metro.
  • 3,457 Washington residents now work in grid modernization (1,138) and energy storage (2,341)
  • 10.1% of Washington residents employed in clean energy are veterans, nearly double the national average (6%).
  • Of the top 10 counties by clean energy jobs per capita, five have populations under 100,000.
  • Washington’s clean vehicle job growth (21.4%) outpaced the sector’s national average (15.4%)
  • Clean energy employs 11X more Washington residents all fossil fuels combined (7,304).
  • 55% of Washington energy sector employees  (153,425) work in clean energy (83,728)
  • Less than 12,000 jobs separates Washington (#14) from the #10 state for clean energy employment (Virginia)
  • 45% of Washington’s clean energy jobs are based outside the Seattle metro area

DOWNLOAD

The complete report is available for download at this link.

Looking For More Info?

U.S. Energy & Employment Report (USEER)

This report follows E2’s Clean Jobs America analysis which found the clean energy jobs account for nearly 3.3 million jobs across all 50 states and the District of Columbia. Both reports expand on data from the U.S. Energy and Employment Report (USEER) produced by the Energy Futures Initiative (EFI) in partnership with the National Association of State Energy Officials (NASEO), using data collected and analyzed by the BW Research Partnership. E2 is a partner on the USEER, the fourth installment of the energy survey first released by the Department of Energy in 2016. Clean energy jobs have grown every year since the first report was released in 2016.

If you are looking for additional insight into E2’s Clean Jobs California 2019 or our other Clean Jobs America reports, visit e2.org/reports. You can also contact E2 Communications Director Michael Timberlake ([email protected]). An FAQ is also available here to answer any questions.

Other E2 Clean Jobs Reports

Clean Jobs Washington is only one in a series of state and industry reports produced by E2 and our partners.

View Report »

Thank Governor Sisolak for his Executive Order 2019-22

Governor Sisolak issued Executive Order 2019-22 on Friday, November 21, 2019, committing to reduce carbon pollution in Nevada and work toward an equitable and inclusive transition to a carbon neutral, clean energy economy. In his speech following the signing of the executive order, Governor Sisolak announced that Nevada intends to join the 11 other states in the […]

Support Transportation and Climate Initiative (TCI)

We in New York have a unique opportunity to significantly reduce harmful carbon emissions from the transportation sector while also modernizing the region’s transit systems and creating tens of thousands of jobs. New York and 11 other Northeast and Mid-Atlantic states and Washington, D.C., are part of the Transportation and Climate Initiative (TCI), a state-led coalition working […]

Support the 2019 Utility EV Infrastructure Bill (SB-77)

On October 23, The Colorado Public Utilities Commission (PUC) opened a proceeding to gather input from stakeholders on what information would be useful for electric utilities to include in upcoming proposals to support transportation electrification.In this letter, E2 members and supporters urge the PUC to act boldly to increase access to electricity as a transportation fuel while ensuring reliability […]

District-By-District | Clean Jobs Oregon 2019

Date: November 20, 2019

Clean Jobs Oregon| District-By-District

According to an analysis of every Oregon state senate district, more than 55,400 Oregonians now work in clean energy industries and more than $6.7 billion has been invested in wind and solar energy projects – generating $258 million in public revenue.

Oregon’s Statewide 2019 Clean Energy Jobs Report
Who Are My Representatives?

This job growth and development has been driven by smart policies like the Renewable Portfolio Standard, Clean Fuels Program and Coal to Clean.

But this growth is only scratching the surface of what Oregon’s clean energy economy can achieve according to this latest analysis. By passing the state a cap and invest program during the 2020 legislative cycle, Oregon could nearly double its total clean energy jobs (adding 50,000), increase real GDP 2.5% by 2050, and generate $4.5 billion in proceeds to be invested in communities throughout Oregon by 2030.

To learn more about the current economic benefits clean energy is providing in every Oregon senate district, click on the Senator’s name and district linked in the below table.

How to Download: Use the tables below to locate and download all 30 factsheets for every Oregon state senate district. Each factsheet details out the district-specific jobs and economic impact resulting from Oregon’s climate policies.

Oregon State Senate

Looking for More Info?

Statewide Jobs Report

For details on clean energy’s statewide impact on jobs in California, including at the county and metro levels, breakdowns for each clean tech subsector, by congressional districts, and information on how the jobs spread across the state’s value chain, visit E2’s Clean Jobs Oregon 2019 report page to download .

U.S. Energy & Employment Report (USEER)

This district-by-district report follows E2’s Clean Jobs America analysis which found the clean energy jobs account for nearly 3.3 million jobs across all 50 states and the District of Columbia. Both reports expand on data from the U.S. Energy and Employment Report (USEER) produced by the Energy Futures Initiative (EFI) in partnership with the National Association of State Energy Officials (NASEO), using data collected and analyzed by the BW Research Partnership. E2 is a partner on the USEER, the fourth installment of the energy survey first released by the Department of Energy in 2016. Clean energy jobs have grown every year since the first report was released in 2016.

If you are looking for additional insight into E2’s District-by-District | Clean Jobs California 2019 or our other Clean Jobs America reports, visit e2.org/reports. You can also contact E2 Communications Director Michael Timberlake ([email protected]). An FAQ is also available here to answer any questions.

Other Clean Jobs Reports

District-by-District | Clean Jobs Oregon 2019 is only one in a series of state and industry reports produced by E2 and our partners.

View Report »

Investing in Michigan’s Water Infrastructure – An Economic Opportunity

Date: November 14, 2019

Michigan water infrastructure report cover

PROTECTING THE ECONOMY, CREATING NEW JOBS, AND DRIVING GROWTH

Michigan has for decades underinvested in its water infrastructure at the expense of the economy and the health of families in the state. To ensure Michigan’s economy continues to grow — and that all Michiganders enjoy a high quality of life — this gap should be closed.

Fortunately, investing an additional $12.2 billion in Michigan’s own water infrastructure needs on top of existing expenditures would over the next two decades help create nearly 90,000 direct job-years in multiple industries — including good jobs for veterans — while generating about $441.3 million in additional earned income for state residents annually.

This essential spending would also help businesses in the state’s water services industry become national leaders in developing and commercializing new water technologies, just as early-mover states like California have become national leaders in clean tech. And it would ensure that all Michigan industries, whether they are directly or indirectly reliant on clean, affordable water, are in the best position possible for decades of ongoing growth.

But first, we must fix the system.

REPORT TOPLINES

  • $12 billion in new spending is needed to update critical water infrastructure in Michigan and avoid more long-term economic and health damage to the state
  • New expenditures directly lead to the creation of 89,880 full-time job-years
  • Those 90,000 direct jobs would generate $8.8 billion in new wages workers and their families can inject into their local economies
  • New jobs and wages will generate $694 million in total tax revenue over two decades, with more than 80 percent going to local and state municipalities ($560 million)
  • Michigan is currently spending $22,000 a day on bottled water for Flint, Michigan alone. Continuing to underfund and defer critical maintenance improvements to water systems across the state risks similar impacts in other cities.
  • While the cost of improving Michigan’s safe drinking water systems is greater than the direct economic benefits, this report focuses only on one small piece of the economic benefits – the direct additional jobs and spending. E2 and BW Research did not analyze indirect or induced benefits like improved health outcomes for citizens, long-term benefits on younger populations, and economic activity created by improving clean water access for businesses.

METHODOLOGY

For the jobs, income and tax revenue data, E2 contracted BW Research which used the Emsi Input-Output model that traces spending and infrastructural developments through the economy to determine the economic impact of the change in water infrastructure spending in the state of Michigan.45

The cumulative effects of the initial job change are quantified and the results are categorized into direct, indirect and induced effects.

  • Direct effects show the change in the economy associated with the initial job creation (or loss), or how the industry experiences the change (i.e., workers digging ditches to replace pipe).
  • Indirect effects include all the backward linkages, or the supply chain responses as a result of the initial job change (i.e., water pipe manufacturers).
  • Induced effects refer to household spending and are the result of workers who are responsible for the direct and indirect effects spending their wages (i.e., direct and indirect workers spend income on clothes, food, healthcare, etc.).

DOWNLOAD

The complete report is available for download at this link.


View Report »

Sign Up for Email Updates


"*" indicates required fields

This field is for validation purposes and should be left unchanged.

Our Latest Press Releases


Releases

Six Emerging Environmental Entrepreneurs Selected for National Fellowship

The E2 & 1 Hotels the fellowship program is designed to help early career environmentally-minded entrepreneurs and community leaders to create and implement unique projects at the intersection of the economy and environment. This year’s projects span a wide...


Releases

E2: Repealing EPA’s Endangerment Finding For Vehicle Emissions Raises Costs for Businesses and Consumers

The EPA officially revoked the endangerment finding for greenhouse gas (GHG) emissions and eliminated clean vehicle standards in a blow to both our economy and our environment.


Releases

E2: Companies Cancelled $34.8B, 38K Jobs for Clean Energy Projects in 2025, Outpacing New Investments 3-to-1

Businesses abandoned $5.1 billion in large-scale factories and clean energy projects in December, capping a turbulent year for the sector that saw nearly $35 billion in investments disappear along with more than 38,000 current and future jobs, according to ...


Donate Today