District-By-District | Clean Jobs Oregon 2019

Date: November 20, 2019

Clean Jobs Oregon| District-By-District

According to an analysis of every Oregon state senate district, more than 55,400 Oregonians now work in clean energy industries and more than $6.7 billion has been invested in wind and solar energy projects – generating $258 million in public revenue.

Oregon’s Statewide 2019 Clean Energy Jobs Report
Who Are My Representatives?

This job growth and development has been driven by smart policies like the Renewable Portfolio Standard, Clean Fuels Program and Coal to Clean.

But this growth is only scratching the surface of what Oregon’s clean energy economy can achieve according to this latest analysis. By passing the state a cap and invest program during the 2020 legislative cycle, Oregon could nearly double its total clean energy jobs (adding 50,000), increase real GDP 2.5% by 2050, and generate $4.5 billion in proceeds to be invested in communities throughout Oregon by 2030.

To learn more about the current economic benefits clean energy is providing in every Oregon senate district, click on the Senator’s name and district linked in the below table.

How to Download: Use the tables below to locate and download all 30 factsheets for every Oregon state senate district. Each factsheet details out the district-specific jobs and economic impact resulting from Oregon’s climate policies.

Oregon State Senate

Looking for More Info?

Statewide Jobs Report

For details on clean energy’s statewide impact on jobs in California, including at the county and metro levels, breakdowns for each clean tech subsector, by congressional districts, and information on how the jobs spread across the state’s value chain, visit E2’s Clean Jobs Oregon 2019 report page to download .

U.S. Energy & Employment Report (USEER)

This district-by-district report follows E2’s Clean Jobs America analysis which found the clean energy jobs account for nearly 3.3 million jobs across all 50 states and the District of Columbia. Both reports expand on data from the U.S. Energy and Employment Report (USEER) produced by the Energy Futures Initiative (EFI) in partnership with the National Association of State Energy Officials (NASEO), using data collected and analyzed by the BW Research Partnership. E2 is a partner on the USEER, the fourth installment of the energy survey first released by the Department of Energy in 2016. Clean energy jobs have grown every year since the first report was released in 2016.

If you are looking for additional insight into E2’s District-by-District | Clean Jobs California 2019 or our other Clean Jobs America reports, visit e2.org/reports. You can also contact E2 Communications Director Michael Timberlake ([email protected]). An FAQ is also available here to answer any questions.

Other Clean Jobs Reports

District-by-District | Clean Jobs Oregon 2019 is only one in a series of state and industry reports produced by E2 and our partners.

View Report »

Investing in Michigan’s Water Infrastructure – An Economic Opportunity

Date: November 14, 2019

Michigan water infrastructure report cover

PROTECTING THE ECONOMY, CREATING NEW JOBS, AND DRIVING GROWTH

Michigan has for decades underinvested in its water infrastructure at the expense of the economy and the health of families in the state. To ensure Michigan’s economy continues to grow — and that all Michiganders enjoy a high quality of life — this gap should be closed.

Fortunately, investing an additional $12.2 billion in Michigan’s own water infrastructure needs on top of existing expenditures would over the next two decades help create nearly 90,000 direct job-years in multiple industries — including good jobs for veterans — while generating about $441.3 million in additional earned income for state residents annually.

This essential spending would also help businesses in the state’s water services industry become national leaders in developing and commercializing new water technologies, just as early-mover states like California have become national leaders in clean tech. And it would ensure that all Michigan industries, whether they are directly or indirectly reliant on clean, affordable water, are in the best position possible for decades of ongoing growth.

But first, we must fix the system.

REPORT TOPLINES

  • $12 billion in new spending is needed to update critical water infrastructure in Michigan and avoid more long-term economic and health damage to the state
  • New expenditures directly lead to the creation of 89,880 full-time job-years
  • Those 90,000 direct jobs would generate $8.8 billion in new wages workers and their families can inject into their local economies
  • New jobs and wages will generate $694 million in total tax revenue over two decades, with more than 80 percent going to local and state municipalities ($560 million)
  • Michigan is currently spending $22,000 a day on bottled water for Flint, Michigan alone. Continuing to underfund and defer critical maintenance improvements to water systems across the state risks similar impacts in other cities.
  • While the cost of improving Michigan’s safe drinking water systems is greater than the direct economic benefits, this report focuses only on one small piece of the economic benefits – the direct additional jobs and spending. E2 and BW Research did not analyze indirect or induced benefits like improved health outcomes for citizens, long-term benefits on younger populations, and economic activity created by improving clean water access for businesses.

METHODOLOGY

For the jobs, income and tax revenue data, E2 contracted BW Research which used the Emsi Input-Output model that traces spending and infrastructural developments through the economy to determine the economic impact of the change in water infrastructure spending in the state of Michigan.45

The cumulative effects of the initial job change are quantified and the results are categorized into direct, indirect and induced effects.

  • Direct effects show the change in the economy associated with the initial job creation (or loss), or how the industry experiences the change (i.e., workers digging ditches to replace pipe).
  • Indirect effects include all the backward linkages, or the supply chain responses as a result of the initial job change (i.e., water pipe manufacturers).
  • Induced effects refer to household spending and are the result of workers who are responsible for the direct and indirect effects spending their wages (i.e., direct and indirect workers spend income on clothes, food, healthcare, etc.).

DOWNLOAD

The complete report is available for download at this link.


View Report »

Clean Cars for America is a Win for U.S. Jobs and Economy

E2: Schumer plan unleashes “U.S. innovation into the marketplace”  WASHINGTON (September 25, 2019) – Senator Chuck Schumer (D-NY) today introduced his Clean Cars for America plan to advance the U.S. electric vehicle market and build out charging infrastructure across the country. The following is a statement from Sandra Purohit, federal advocacy director for the national, […]

Energy News: Chicago apartment renters push for better access to electric vehicle charging

Perkins recently completed a fellowship with E2 (Environmental Entrepreneurs), a clean energy advocacy group, in which she began a community charging project. Over the past year, she’s been interviewing building managers and owners at publicly accessible spots throughout the city — primarily small businesses and houses of worship — to gauge interest in hosting chargers […]

MEMBERS ONLY – E2 Partner Event: EV Week 2019 VIP Reception & Panel Discussion

On Friday, October 11th, join Charge Across Town, event sponsors, and E2 for a VIP wine and cheese reception and panel discussion – The Road to Zero.  Despite sharp growth in the EV sector, vehicle emissions keep rising.  Unless the emissions trend is reversed, the state could stall on its route to clean air.  The panel will discuss how […]

NYC Climate Week Event: Making NY An Offshore Wind Jobs Hub

E2 and our partners will host a NYC Climate Week event, “Making New York an Offshore Wind Jobs Hub” on Thursday, Sept 26.  Under New York State’s Climate Leadership and Community Protection Act, which passed this summer, the state is supporting the development of 9,000 megawatts of offshore wind energy by 2035. Join our offshore […]

Revoking California Auto Emissions Waiver Hurts Consumers, Businesses, U.S. Competitiveness

E2: “President Trump is putting our country in reverse” WASHINGTON (September 19, 2019) – The Trump administration today formally announced it will seek to revoke California and other states’ rights to set auto emission standards more stringent than federal standards, jeopardizing fuel economy, innovation and clean vehicle manufacturing jobs while increasing pollution. The decision will […]

Clean Jobs Colorado 2019

Date: September 12, 2019

Colorado’s Clean Energy Potential Reaches New Heights

Colorado is leading the Mountain West’s clean energy economy.

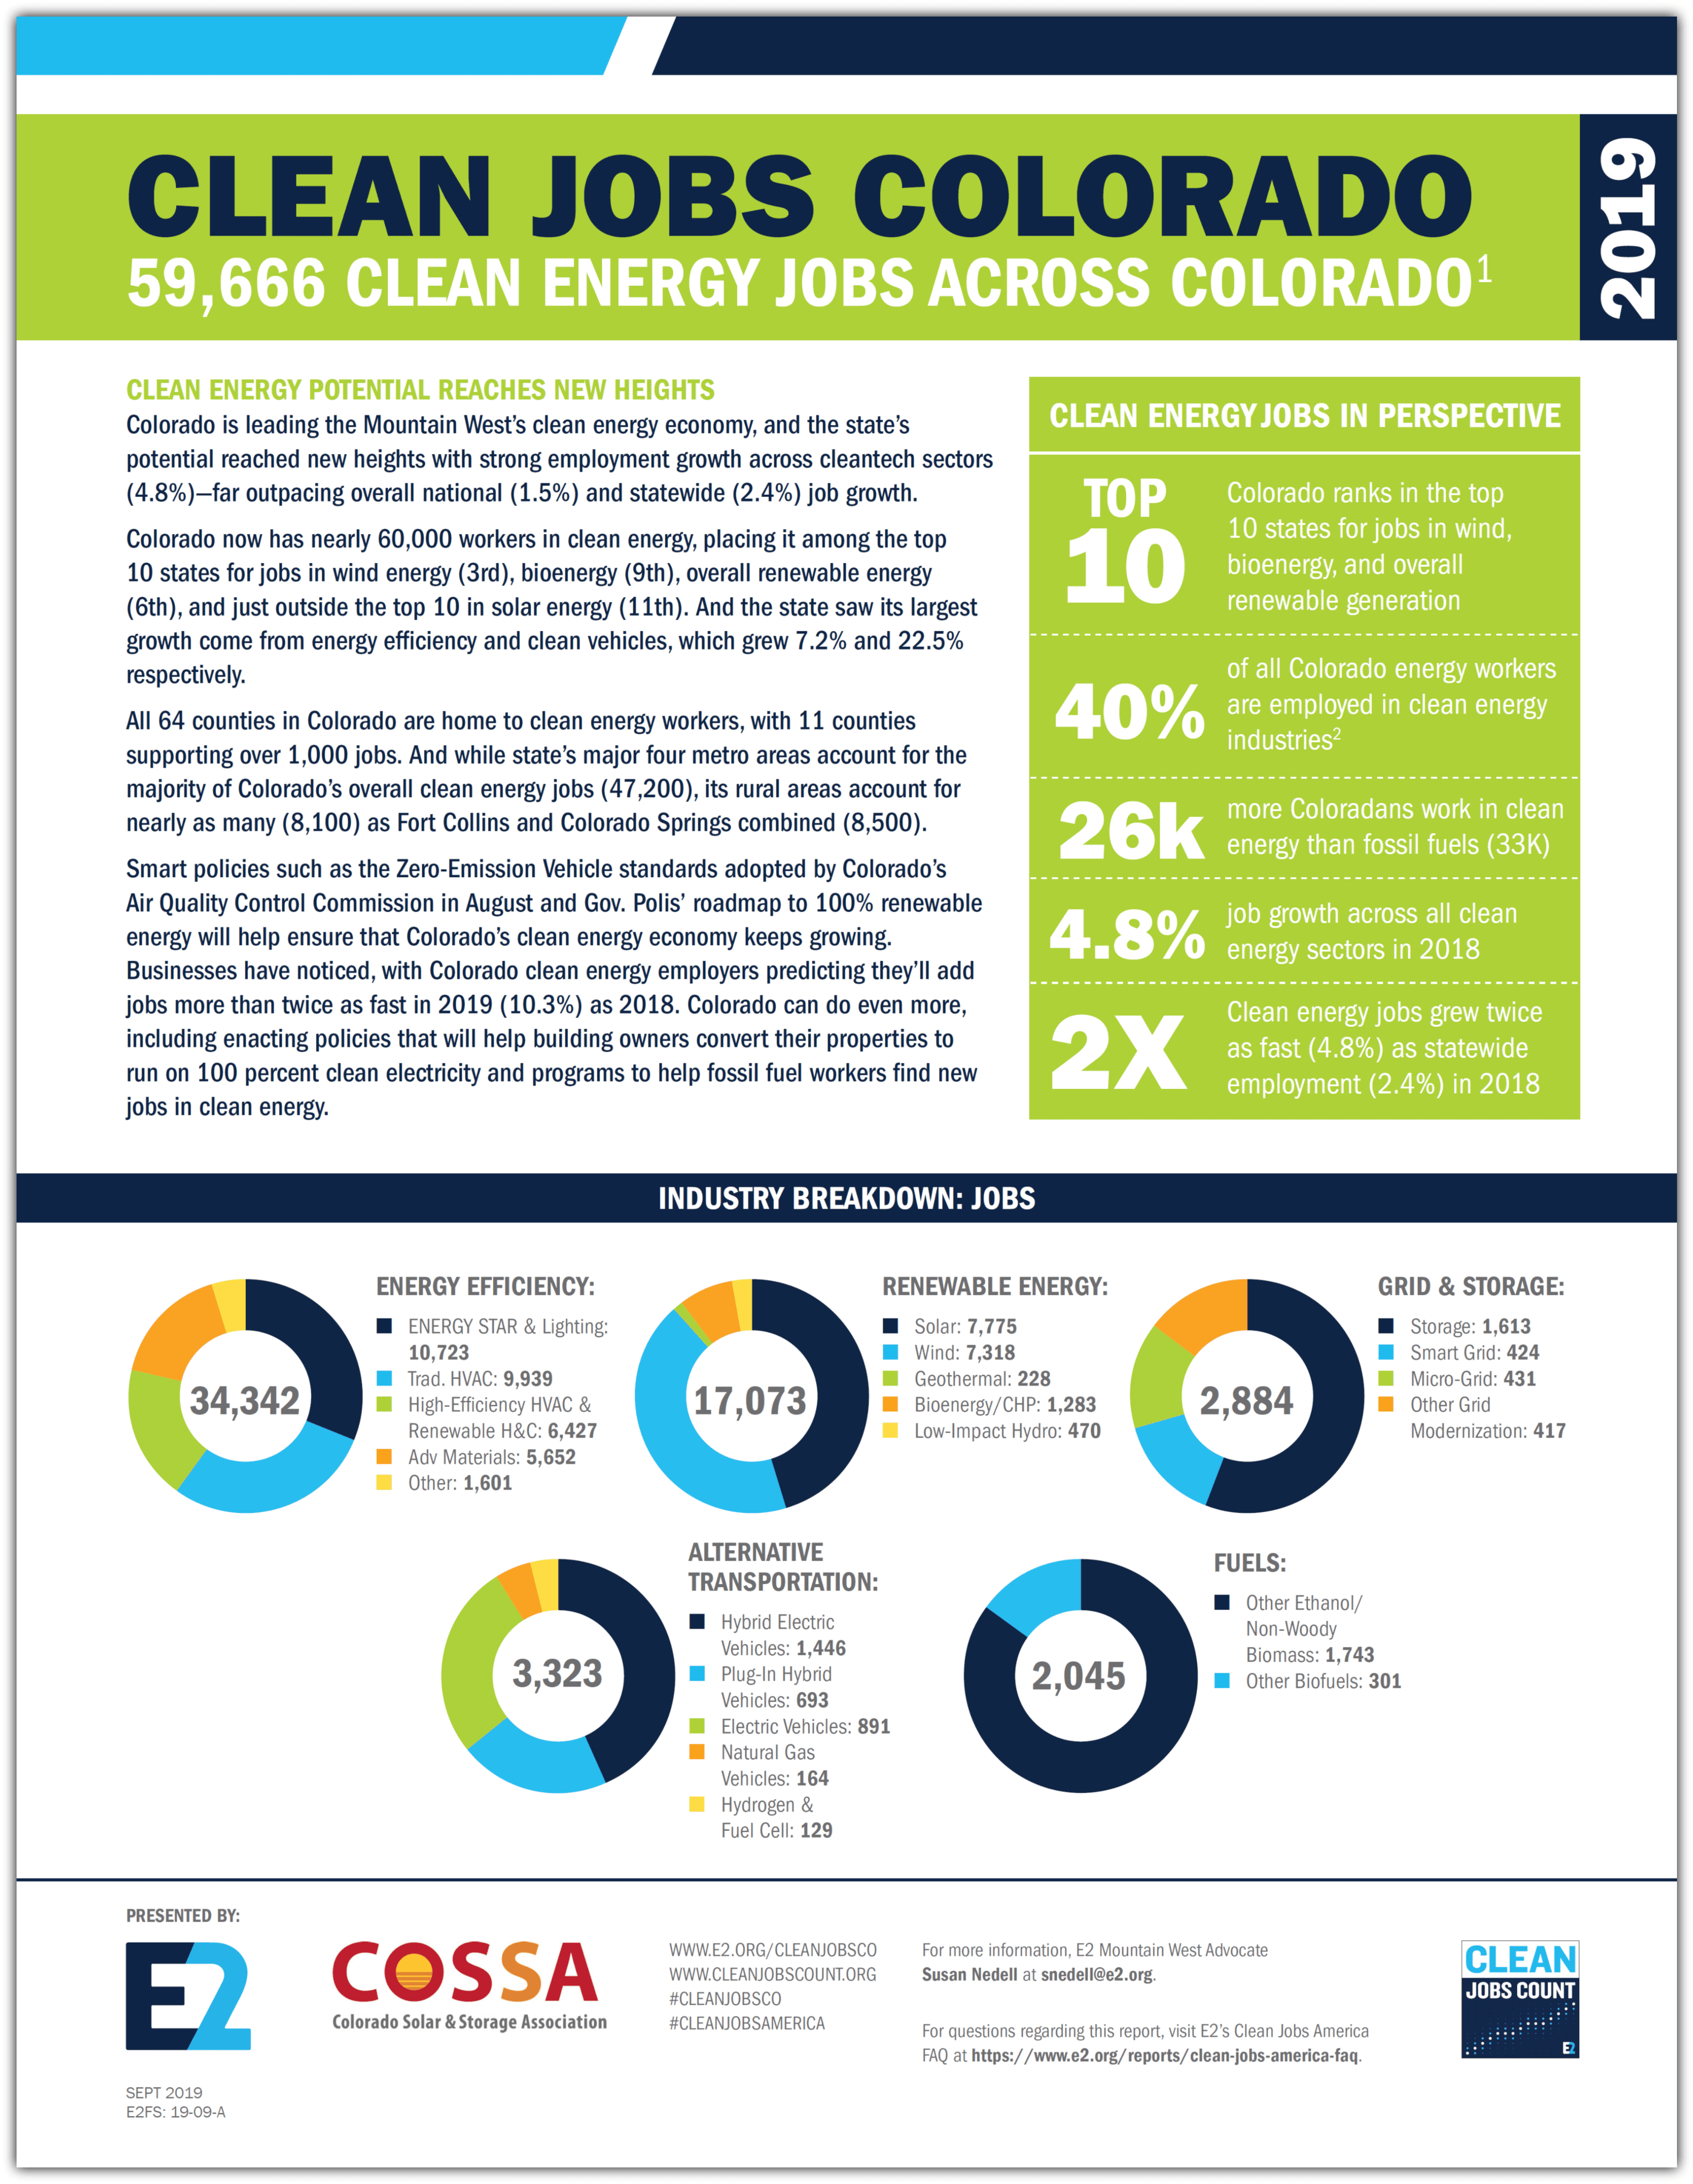
With nearly 60,000 clean energy workers now, the state’s potential reached new heights in 2018 with strong employment growth across cleantech sectors (4.8%)—far outpacing overall national (1.5%) and statewide (2.4%) job growth.

According to Clean Jobs Colorado 2019 (downloadable PDF) report, Colorado’s is now among the top 10 states for jobs in three sectors: wind energy (3rd), bioenergy (9th), and overall renewable energy (6th). The state fell just outside the Top 10 in solar energy (11th). However, the majority of Colorado’s clean energy job growth came from energy efficiency and clean vehicles, which grew 7.2% and 22.5%respectively.

Analyzing the state geographically,the employment analysis found that while Denver and Boulder accounted for nearly one out of every three clean jobs in the state, about 20 percent (29,000) are in areas outside the Denver, Boulder, Colorado Springs, and Fort Collins metro areas. Additionally, all 64 counties in the state are home to clean energy workers, with 11 counties supporting at least 1,100. Denver led all counties with more than 13,200 jobs, followed by Arapahoe (7,600) and Jefferson (5,800) counties. By density, Jackson, Denver, and Boulder counties led the state in clean jobs per 1,000 employable residents. All 64 counties in Colorado are home to clean energy workers, with 11 counties supporting over 1,000 jobs.

Smart policies such as the Zero-Emission Vehicle standards adopted by Colorado’s Air Quality Control Commission in August and Gov. Polis’ roadmap to 100% renewable energy will help ensure that Colorado’s clean energy economy keeps growing. And businesses have noticed, with Colorado clean energy employers predicting they’ll add jobs more than twice as fast in 2019 (10.3%) as 2018.

Colorado Job Sector Toplines

  • Energy Efficiency – 34,342 jobs
  • Renewable Energy – 17,073 jobs
  • Solar Energy – 7,775 jobs
  • Wind Energy – 7,318 jobs
  • Clean Vehicles – 3,323 jobs
  • Biofuels – 2,045 jobs
  • Energy Storage – 1,692 jobs
  • Grid Modernization – 1,272 jobs
  • ALL Clean Energy Sectors – 59,666 jobs

Other Highlights from 2018

  • Clean energy jobs also now employ 26,000 more workers than the state’s entire fossil fuel industry (10,022)
  • 8,100 workers Coloradans located in rural areas work in clean energy
  • 64% of clean energy workers are employed by businesses with fewer than 20 total employees
  • Colorado clean energy employers are projecting 10.3% employment growth for 2019.
  • Construction (37.6%) and professional services (40.7%) make up the majority of clean energy jobs.
  • 9.6% of Coloradans employed in clean energy are veterans
  • Denver led all counties in Colorado with 13,200 jobs, followed by Arapahoe (7,600) and Jefferson (5,868) counties

Looking for More Info?

This report follows E2’s Clean Jobs America analysis which found the clean energy jobs account for nearly 3.3 million jobs across all 50 states and the District of Columbia. Both reports expand on data from the U.S. Energy and Employment Report (USEER) produced by the Energy Futures Initiative (EFI) in partnership with the National Association of State Energy Officials (NASEO), using data collected and analyzed by the BW Research Partnership. E2 is a partner on the USEER, the fourth installment of the energy survey first released by the Department of Energy in 2016. Clean energy jobs have grown every year since the first report was released in 2016.

If you are looking for additional insight into E2’s Clean Jobs Colorado 2019 or our other Clean Jobs America reports, visit e2.org/reports. You can also contact E2 Communications Director Michael Timberlake ([email protected]). An FAQ is also available here to answer any questions.

DOWNLOAD

The complete report is available for download at this link.

OTHER CLEAN JOBS REPORTS

Clean Jobs North Carolina is only one in a series of state and industry reports produced by E2 and our partners.

View Report »

House Protects Coastal Economies From Threat of Offshore Oil Drilling

WASHINGTON (September 11, 2019) – Today, the U.S. House of Representatives passed HR 1941 and HR 205, which would permanently protect coastal economies along Florida’s Gulf Coast and the Atlantic and Pacific Coasts from expanded offshore drilling. Following is a statement from Bob Keefe executive director of the national nonpartisan business group E2 (Environmental Entrepreneurs): […]

Support Clean Energy Tax Extenders

The best chance to move on climate policy now comes in the form of tax extenders. These clean energy extenders are incentives that habitually expire and have to be renewed – or ‘extended’ – by Congress, usually on an annual basis. With increased interest around providing market certainty to a suite of  clean energy technologies […]

Clean Jobs California 2019

Date: August 20, 2019

America’s Clean Energy Economy Juggernaut

With nation-leading public policies like the Low Carbon Fuel Standard and Renewables Portfolio Standard, California, with its more than half a million workers across clean energy industries, remains far and away the nation’s shining example of clean economic prosperity. Across all states, California supports one out of every seven U.S. clean energy jobs, four out of every ten U.S. solar energy jobs,  and one more than one out of every four U.S. renewable generation jobs. In fact, California’s is home to more renewable generation jobs than the next top six states combined and twice as many energy efficiency jobs as the no. 2 state (Texas).

While the solar energy industry remains the standard bearer of clean energy employment and historical growth in California, other industries are making significant headway; notably, California’s clean vehicle industry saw a 22 percent increase in employment in 2018. In 2019, California is expected to once again drive the nation’s clean economic growth with state employers projecting nearly a 10 percent increase in jobs across renewable generation, energy efficiency, clean vehicles, grid services, energy storage, and more.

Combined with this market domination, big opportunities remain as the world’s fifth-largest economy takes aim at meeting its ambitious carbon reduction targets.

A BIGGER PICTURE

This report focuses solely on the energy sector of the economy and does not include jobs in retail trade, repair services, water or waste management, and indirect employment or induced employment.

California Job Sector Toplines

  • Energy Efficiency – 318,542 jobs
  • Renewable Energy – 143,728 jobs
  • Solar Energy – 126,507 jobs
  • Clean Vehicles – 22,389 jobs
  • Energy Storage – 16,633 jobs
  • Bioenergy/CHP – 7,212 jobs
  • Grid Modernization – 6,166 jobs
  • Wind Energy – 5,785 jobs
  • Clean Fuels – 5,477 jobs
  • ALL Clean Energy Sectors – 512,934 jobs

Highlights

According to Clean Jobs California:

  • Clean energy employs five times more Californians than all fossil fuels combined (110,000)
  • More than 57% of California clean energy workers are employed by businesses with fewer than 20 employees
  • If included in E2’s state rankings, Los Angeles and San Francisco metro areas would rank no. 5 and no. 10 respectively. If combined, the two metros would be the no. 2 state for clean energy jobs in the U.S.
  • Clean vehicle technologies is the only industry California does not rank first in for jobs, trailing Michigan by fewer than 3,000 jobs
  • Nearly four out of every ten U.S. solar jobs are in California
  • Californian clean energy employers project nearly 10% growth in jobs in 2019
  • Bioenergy and combined heat and power made up the second most renewable generation jobs (7,212), followed by wind (5,785)
  • Construction (50.7%) accounts for half of California’s clean energy jobs.
  • 22,800 Californians now work in grid modernization (6,166) and energy storage (16,633)
  • 9.7 % of Californians employed in clean energy are veterans – far above the national average (6%)

DOWNLOAD

The complete report is available for download at this link.

Looking For More Info?

District-By-District Economic Impact

For details on clean energy’s overall economic impact in California, visit E2’s District-By-District: Clean Jobs California 2019  report page to download 120 individual factsheets for all 120 state legislative districts. The factsheets detail the investments in clean energy, jobs created, emissions, reduced, and cap and trade funds implemented in each district.

U.S. Energy & Employment Report (USEER)

This report follows E2’s Clean Jobs America analysis which found the clean energy jobs account for nearly 3.3 million jobs across all 50 states and the District of Columbia. Both reports expand on data from the U.S. Energy and Employment Report (USEER) produced by the Energy Futures Initiative (EFI) in partnership with the National Association of State Energy Officials (NASEO), using data collected and analyzed by the BW Research Partnership. E2 is a partner on the USEER, the fourth installment of the energy survey first released by the Department of Energy in 2016. Clean energy jobs have grown every year since the first report was released in 2016.

If you are looking for additional insight into E2’s Clean Jobs California 2019 or our other Clean Jobs America reports, visit e2.org/reports. You can also contact E2 Communications Director Michael Timberlake ([email protected]). An FAQ is also available here to answer any questions.

Other E2 Clean Jobs Reports

Clean Jobs California is only one in a series of state and industry reports produced by E2 and our partners.

View Report »

Sign Up for Email Updates


"*" indicates required fields

This field is for validation purposes and should be left unchanged.

Our Latest Press Releases


Releases

House Republicans Launch Push to Reinstate Clean Energy Tax Credits

“Amid soaring electricity costs and tens of billions in clean energy projects getting cancelled and delayed across the country, this is a modest – but smart – step back in the right direction."


Donate Today