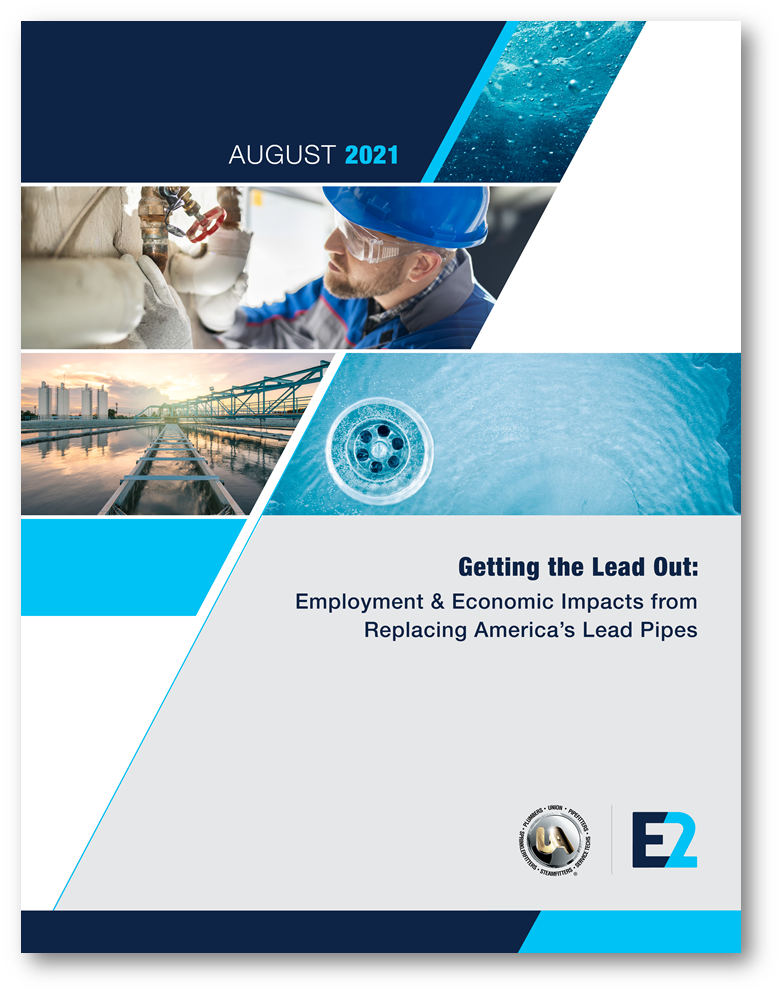
Getting the Lead Out: Employment & Economic Impacts of Lead Service Line Replacement

Date: August 3, 2021

Summary:

Based on the Biden administration’s plans to invest $45 billion to replace 100 percent of lead service lines in America, the findings from Getting the Lead Out: Employment & Economic Impacts from Replacing America’s Lead Service Lines, this report from E2 and the United Association of Union Plumbers & Pipefitters (UA) estimates that the $45 billion invested in this program will create and support 56,080 jobs annually for 10 years, or a total of 560,800 job-years. This annual estimate includes 26,900 direct jobs—construction workers, plumbers, pipefitters, heavy equipment operators—as a direct result of this activity. Another 13,600 jobs that last for 10 years are created throughout the value chain, and 13,800 jobs are created each year for 10 years as a result of workers spending their paycheck.

About 84 percent of all jobs created through this investment are in construction (52 percent), professional and business services (24 percent), and manufacturing industries (8 percent). Insofar as the bulk of these jobs involve high-skill construction occupations, the jobs created will provide good wages and training opportunities for local residents and promote economic benefits to affected communities.

This investment into cleaning up our nation’s water supply also would generate $38.3 billion in labor income, $11.7 billion in taxes, and $53.9 billion in additional value to the economy. That would represent a 120 percent return on investment.

In addition to the jobs created and value added to the economy from this activity, additional benefits like increased positive health outcomes would be generated. It has been estimated that an additional $22,000 of societal benefits are generated for every lead pipe replaced as a result of lower cardiovascular disease. Since in many areas lead service lines are more likely to exist in environmental justice communities, and since Black and Latino children have disproportionately high overall lead exposure, replacing these lead pipes will also greatly benefit low-income and minority households.

The scope of this work is massive and reaches every state. The Natural Resources Defense Council (NRDC) estimates that between 9.7 million to more than 12 million lead service lines are distributing water throughout our nation. About 700,000 or more of these service lines are found in Illinois, while Ohio, Michigan, New York, New Jersey Missouri and Wisconsin each contain more than 300,000 of the nation’s lead service lines; the top ten states total about 4 million.
This field is for validation purposes and should be left unchanged.

Findings

  • 560,800 total job-years*
  • $104 billion: total economic activity generated
  • 10 million lead service lines that need to be replaced

* 56,080 jobs annually over ten years

** Includes $38.3B in labor income, $11.7B in taxes and $53.9B in additional economic benefits

Methodology

BW Research used IMPLAN to conduct the economic impact analysis, resulting in the jobs, value-added, labor income, and taxes data. IMPLAN is an input-output modeling software that tracks spending patterns through the economy and their resulting impacts on economic indicators. The cumulative effects of the initial investment are quantified, and the results are categorized into direct, indirect, and induced effects. To capture interstate flows, direct and indirect impacts are results of national-level multipliers, distributed across states using state-level modeling. Induced impacts are the results of state-level multipliers, so as not to overestimate the impacts of household spending. Workforce data such as occupational demographics and wages are derived from JobsEQ by Chmura. JobsEQ is a workforce data software that derives data from Bureau of Labor Statistics and Census Bureau data, among other sources. Unionization rates are derived from unionstats.com.

  • Direct Impacts show the initial change in the economy associated with the investment. For example, pipefitters installing new service pipes or engineers planning the replacement.
  • Indirect Impacts include the supply chain responses as a result of the initial investment (i.e., water pipe manufacturers).
  • Induced Impacts refer to household spending and are the result of workers who are responsible for the direct and indirect effects spending their wages (i.e., direct and indirect workers spend income on clothes, food, healthcare, etc.).
  • Labor Income includes all forms of employment income, such as employee compensation (wages and benefits) and proprietor income (i.e. payments received by self-employed individuals and unincorporated business owners). Labor income is a component of value added.
  • Value Added is defined as the total value of production after netting out intermediate goods. This is another term for GDP.

About this Report

This economic impact analysis was conducted by BW Research Partnership for E2 in partnership with the United Association of Union Plumbers and Pipefitters. It uses the Biden Administration’s stated goal of 100 percent removal of lead service lines (LSLs) from America’s drinking water systems, the Natural Resources Defense Council’s (NRDC) national survey of LSLs, and the Environmental Protection Agency’s (EPA) estimated LSL replacement costs.

Special thanks to NRDC and BW Research. For a description of the methodology used in this report, please refer to the explanation on page in Appendix A.

Looking for More Info?

If you are looking for additional insight into Getting the Lead Out: Employment & Economic Impacts from Replacing America’s Lead Service Lines or E2’s other clean energy employment reports, visit e2.org/reports.

View Report »

Electric Trucks Are Just The Start. Congress, Let’s Get Rolling.

Posted on May 20, 2021 by Bob Keefe

Electric pickup trucks are cool. But when it comes to building a cleaner economy and creating the jobs and other economic opportunities that come with it, so are heat pumps, Energy Star appliances and climate finance, the Biden administration showed this week. While up in Michigan the biggest game-changing electric vehicle since Tesla — the Ford F-150 Lightning — stole the […]

Biden American Jobs Plan: What U.S. Economy, Environment Needs

E2: Administration takes a “whole of economy” approach to climate action WASHINGTON (March 31, 2021) – President Biden will outline his plan for rebuilding America’s infrastructure in a speech later today in Pittsburgh. Biden’s American Jobs Plan will focus on how smart investments in priorities such as ensuring safe drinking water, modernizing the energy grid, […]

Achieving California’s Clean Energy Targets: Where The Rubber Meets The Road

WHAT Profound change is afoot in the quest to meet California’s ambitious decarbonization targets and our state’s electric grid is a critical lynchpin; delivering zero-carbon electricity to California citizens and businesses is critical as we work to power our industries, buildings, and transportation sector with clean electricity.  Realizing 100% clean energy and statewide carbon neutrality […]

PASSED: AB841 Puts Thousands of Unemployed Clean Energy Employees Back to Work

Newly passed bill is type of policy California “needs to help its economic recovery” SACRAMENTO (September 1, 2020) – Late Monday night, the California legislature passed AB 841, a bill that swill streamline millions in investments to expand California’s electric vehicle (EV) charging infrastructure and make improvements to school energy efficiency upgrades. Following is a […]

House Infrastructure Bill Meets the “Severity of the Challenges” U.S. Faces; Clean Energy Stimulus Needed Next

Statement from Director of Federal Advocacy, Sandra Purohit WASHINGTON (July 1, 2020) – The House of Representatives today passed the “Moving Forward Act” (H.R. 2), a $1.5 trillion infrastructure bill that prioritizes clean energy to combat the looming threat of climate change and accelerates America’s economic recovery. The bill includes investments in clean energy, clean […]

Clean Jobs California 2020

Date: June 25, 2020

America’s Clean Energy Powerhouse in the Wake of COVID-19

After a fifth straight year of job growth since E2 (Environmental Entrepreneurs) began tracking U.S. clean energy employment, California’s clean energy economy is facing a torrent of job losses and work freezes so significant it could set the industry back years. What had been one of the nation’s fastest-growing job sectors over the last five years is now one of the fastest-shrinking in the wake of COVID-19-related shutdowns disrupting supply chains and building energy efficiency projects, halting new developments and emptying project pipelines, and slowing investments while wrecking financial outlooks.

Entering 2020, California’s clean energy economy had grown for five straight years since this annual report was first released with clean energy jobs growing to make up 3 percent of the state’s entire workforce.

E2’s Clean Jobs California 2020 details the sheer size of this important employment sector, the troubles it is currently facing due to COVID-19 and how focusing recovery policies on clean energy can get the Golden State’s economy humming again—quickly and for the long run.

INDUSTRY JOB TOPLINES | Q4 2019

  • Energy Efficiency – 323,529 jobs
  • Renewable Energy –142,957 jobs
    • Solar Energy – 124,817 jobs
    • Wind Energy – 2,520 jobs
  • Clean Vehicles – 40,627 jobs
  • Clean Storage – 17,397 jobs
  • Grid Modernization – 6,625 jobs
  • ALL Clean Energy Sectors – 536,919 jobs

DOWNLOAD

The complete report is available for download at this link.

Looking for More Info?

The analysis expands on data from the 2020 U.S. Energy and Employment Report (USEER) produced by the Energy Futures Initiative (EFI) in partnership with the National Association of State Energy Officials (NASEO), using data collected and analyzed by the BW Research Partnership. The report was released in March 2020and is available at www.usenergyjobs.org. E2 is a partner on the USEER, the fifth installment of the energy survey first released by the Department of Energy in 2016 and subsequently abandoned under the Trump administration. Clean energy jobs have grown every year since the first report was released in 2016.

If you are looking for additional insight into E2’s Clean Jobs California 2020 or our other Clean Jobs America reports, visit e2.org/reports. You can also contact E2 Communications Director Michael Timberlake ([email protected]). An FAQ is also available here to answer any questions.

PAST CLEAN JOBS AMERICA REPORTS

Clean Jobs America 2020 is the 3rd clean energy jobs report for California from E2. Previous reports can be accessed in the below links.

View Report »

Oppose Extreme Rollback of the National Environmental Policy Act (NEPA)

The Trump Administration is proposing draconian rollbacks to economic and environmental protections under the National Environmental Policy Act (NEPA). We have until next Tuesday, March 10, 2020 to formally oppose changes that would allow the government to ignore climate impacts, weaken environmental reviews and would make it harder to challenge government and industry projects when they […]

200+ Architects, Engineers, Contractors Urge Congress to Pass AIM Act

Statements from CEO of Chicago-based Whitney Architects and E2 Director of Federal Advocacy WASHINGTON (March 3, 2020) – As the Senate Energy Package (S. 2657) moves to the floor this week, more than  200 architects, engineers and contractors from across the country sent a letter to all senators urging them to include the Kennedy-Carper amendment […]

Thank Governor Sisolak for his Executive Order 2019-22

Governor Sisolak issued Executive Order 2019-22 on Friday, November 21, 2019, committing to reduce carbon pollution in Nevada and work toward an equitable and inclusive transition to a carbon neutral, clean energy economy. In his speech following the signing of the executive order, Governor Sisolak announced that Nevada intends to join the 11 other states in the […]

Support Transportation and Climate Initiative (TCI)

We in New York have a unique opportunity to significantly reduce harmful carbon emissions from the transportation sector while also modernizing the region’s transit systems and creating tens of thousands of jobs. New York and 11 other Northeast and Mid-Atlantic states and Washington, D.C., are part of the Transportation and Climate Initiative (TCI), a state-led coalition working […]

Trump Budget Again Threatens Innovation and Jobs

Statement from E2 Advocacy Director Grant Carlisle WASHINGTON (March 11, 2019) – The Trump administration introduced its federal budget proposal today, once again including cuts to and proposals to eliminate programs that drive investment in clean energy innovation and help American businesses create jobs and drive economic growth across the country. The following is a […]

Sign Up for Email Updates


"*" indicates required fields

This field is for validation purposes and should be left unchanged.

Our Latest Press Releases


Releases

House Republicans Launch Push to Reinstate Clean Energy Tax Credits

“Amid soaring electricity costs and tens of billions in clean energy projects getting cancelled and delayed across the country, this is a modest – but smart – step back in the right direction."


Donate Today