
 America’s Clean Energy Economy Juggernaut
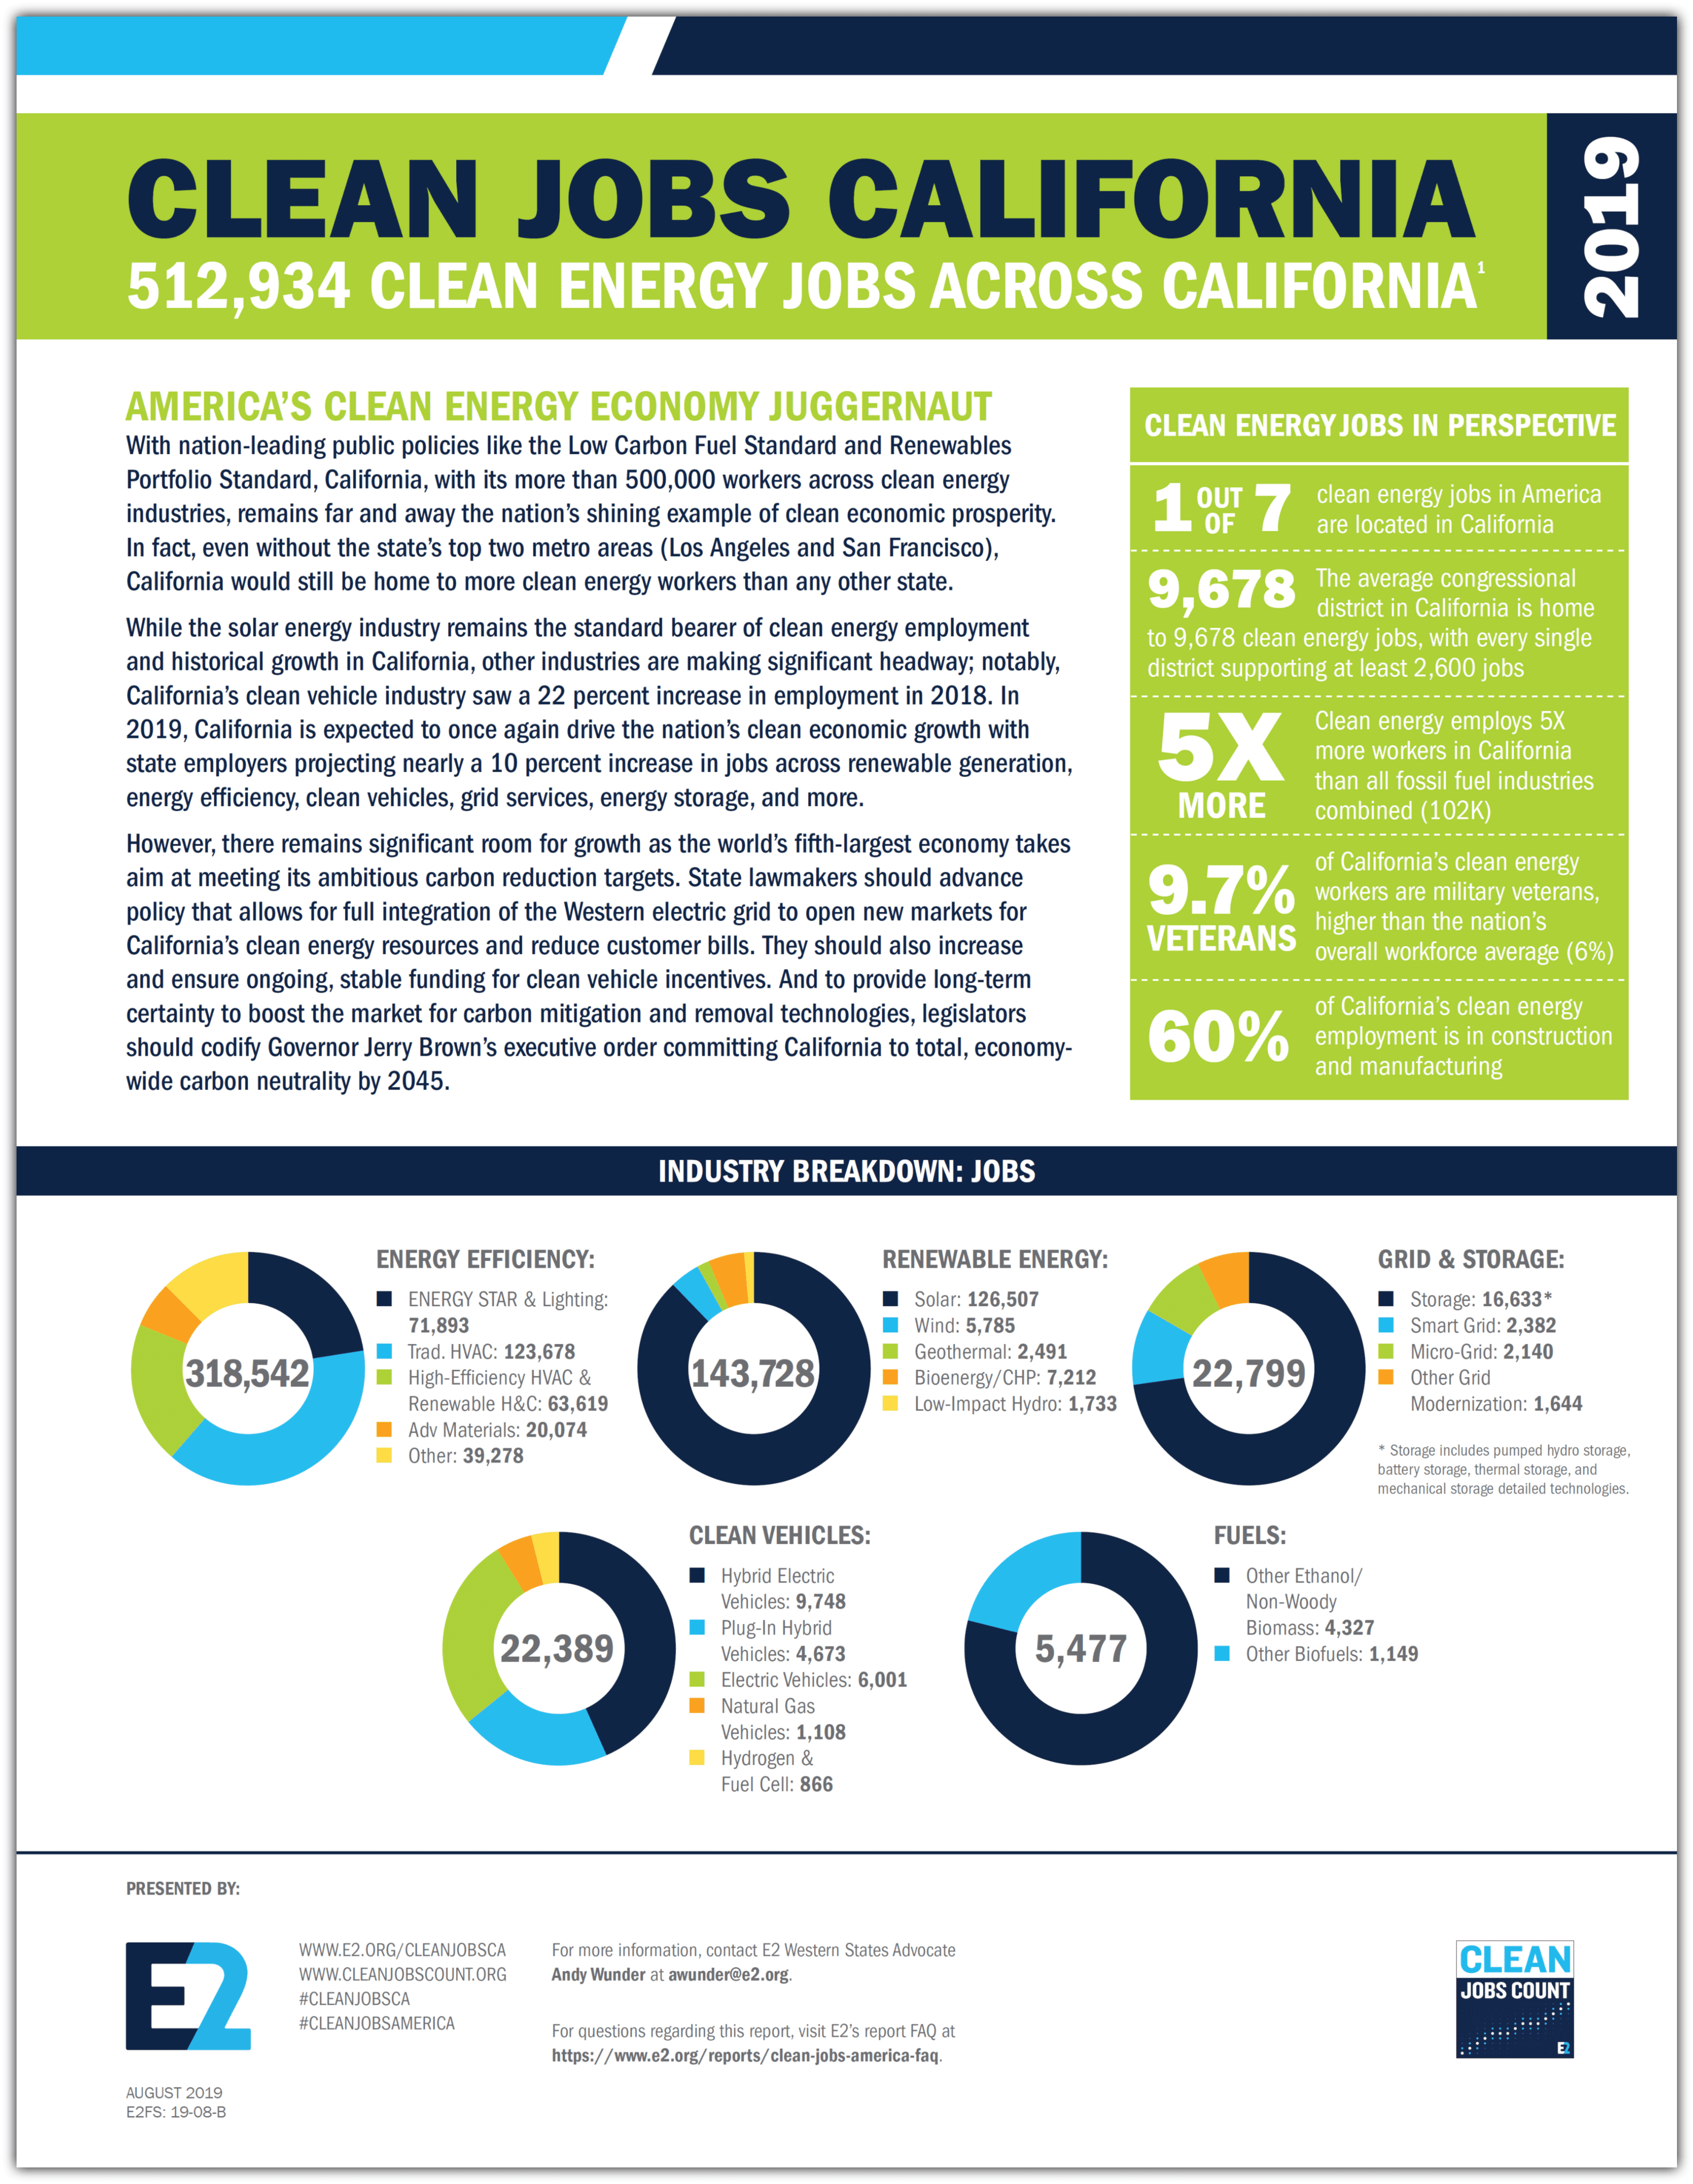
With nation-leading public policies like the Low Carbon Fuel Standard and Renewables Portfolio Standard, California, with its more than half a million workers across clean energy industries, remains far and away the nation’s shining example of clean economic prosperity. Across all states, California supports one out of every seven U.S. clean energy jobs, four out of every ten U.S. solar energy jobs, and one more than one out of every four U.S. renewable generation jobs. In fact, California’s is home to more renewable generation jobs than the next top six states combined and twice as many energy efficiency jobs as the no. 2 state (Texas).
While the solar energy industry remains the standard bearer of clean energy employment and historical growth in California, other industries are making significant headway; notably, California’s clean vehicle industry saw a 22 percent increase in employment in 2018. In 2019, California is expected to once again drive the nation’s clean economic growth with state employers projecting nearly a 10 percent increase in jobs across renewable generation, energy efficiency, clean vehicles, grid services, energy storage, and more.
Combined with this market domination, big opportunities remain as the world’s fifth-largest economy takes aim at meeting its ambitious carbon reduction targets.
A BIGGER PICTURE
This report focuses solely on the energy sector of the economy and does not include jobs in retail trade, repair services, water or waste management, and indirect employment or induced employment.
California Job Sector Toplines
- Energy Efficiency – 318,542 jobs
- Renewable Energy – 143,728 jobs
- Solar Energy – 126,507 jobs
- Clean Vehicles – 22,389 jobs
- Energy Storage – 16,633 jobs
- Bioenergy/CHP – 7,212 jobs
- Grid Modernization – 6,166 jobs
- Wind Energy – 5,785 jobs
- Clean Fuels – 5,477 jobs
- ALL Clean Energy Sectors – 512,934 jobs
Highlights
According to Clean Jobs California:
- Clean energy employs five times more Californians than all fossil fuels combined (110,000)
- More than 57% of California clean energy workers are employed by businesses with fewer than 20 employees
- If included in E2’s state rankings, Los Angeles and San Francisco metro areas would rank no. 5 and no. 10 respectively. If combined, the two metros would be the no. 2 state for clean energy jobs in the U.S.
- Clean vehicle technologies is the only industry California does not rank first in for jobs, trailing Michigan by fewer than 3,000 jobs
- Nearly four out of every ten U.S. solar jobs are in California
- Californian clean energy employers project nearly 10% growth in jobs in 2019
- Bioenergy and combined heat and power made up the second most renewable generation jobs (7,212), followed by wind (5,785)
- Construction (50.7%) accounts for half of California’s clean energy jobs.
- 22,800 Californians now work in grid modernization (6,166) and energy storage (16,633)
- 9.7 % of Californians employed in clean energy are veterans – far above the national average (6%)
DOWNLOAD
The complete report is available for download at this link.
Looking For More Info?
District-By-District Economic Impact
For details on clean energy’s overall economic impact in California, visit E2’s District-By-District: Clean Jobs California 2019 report page to download 120 individual factsheets for all 120 state legislative districts. The factsheets detail the investments in clean energy, jobs created, emissions, reduced, and cap and trade funds implemented in each district.
U.S. Energy & Employment Report (USEER)

This report follows E2’s Clean Jobs America analysis which found the clean energy jobs account for nearly 3.3 million jobs across all 50 states and the District of Columbia. Both reports expand on data from the U.S. Energy and Employment Report (USEER) produced by the Energy Futures Initiative (EFI) in partnership with the National Association of State Energy Officials (NASEO), using data collected and analyzed by the BW Research Partnership. E2 is a partner on the USEER, the fourth installment of the energy survey first released by the Department of Energy in 2016. Clean energy jobs have grown every year since the first report was released in 2016.
If you are looking for additional insight into E2’s Clean Jobs California 2019 or our other Clean Jobs America reports, visit e2.org/reports. You can also contact E2 Communications Director Michael Timberlake ([email protected]). An FAQ is also available here to answer any questions.
Other E2 Clean Jobs Reports
Clean Jobs California is only one in a series of state and industry reports produced by E2 and our partners.
-
- Clean Jobs America 2019 | Nearly 3.3 Million Clean Energy Jobs
- Clean Jobs North Carolina 2019 | Top 10 in Jobs Across Clean Technologies
- District-By-District: Clean Jobs California 2019 | Analysis of Clean Energy’s Economic Benefits Across California Legislative Districts
- Clean Jobs Midwest 2019 |Region added more than 28,000 clean energy jobs in 2018
- Clean Jobs Nevada 2019 | 32,211 Clean Energy Jobs Across Nevada
- Clean Jobs Massachusetts 2019 | 117,669 Clean Energy Jobs Across Massachusetts
- Clean Jobs New York 2019 | 148,453 Clean Energy Jobs Across Empire State
- Clean Jobs Pennsylvania 2019 | 90,772 Clean Energy Jobs Across the Keystone State
- Clean Jobs New Jersey 2019 |51,852 Clean Energy Jobs Across New Jersey
- Energy Efficiency Jobs in America 2018 | 2.25 Million Americans Work in Energy Efficiency
- Clean Jobs Cities 2018 | America’s Top Cities for Clean Energy Jobs
- Clean Jobs California 2018 | Over 500K Californians Working in Clean Energy
- Clean Jobs Oregon 2018 | 55,179 Clean Energy Jobs Across Oregon
- Clean Jobs Washington 2018 | 82,859 clean energy jobs across Washington State
- Clean Jobs Colorado 2018 | 57,591 Clean Energy Jobs Across Colorado