Clean Energy Businesses Are Essential for Illinois
The NRDC showcases E2’s “Mapping Clean Energy” Illinois” interactive map that pinpoints renewable energy and energy efficiency sites, clean energy businesses and electric vehicle charging stations.

The NRDC showcases E2’s “Mapping Clean Energy” Illinois” interactive map that pinpoints renewable energy and energy efficiency sites, clean energy businesses and electric vehicle charging stations.
In an article warning against Iowa legislation to gut energy efficiency, Williams cites E2 data: “The legislation would “stifle a growing, prosperous industry” in Iowa, the sustainability-focused business group Environmental Entrepreneurs (E2) has warned. In 2016, more than 20,000 Iowans worked in energy efficiency jobs such as retrofitting homes and businesses to make them more energy efficient. Clean […]
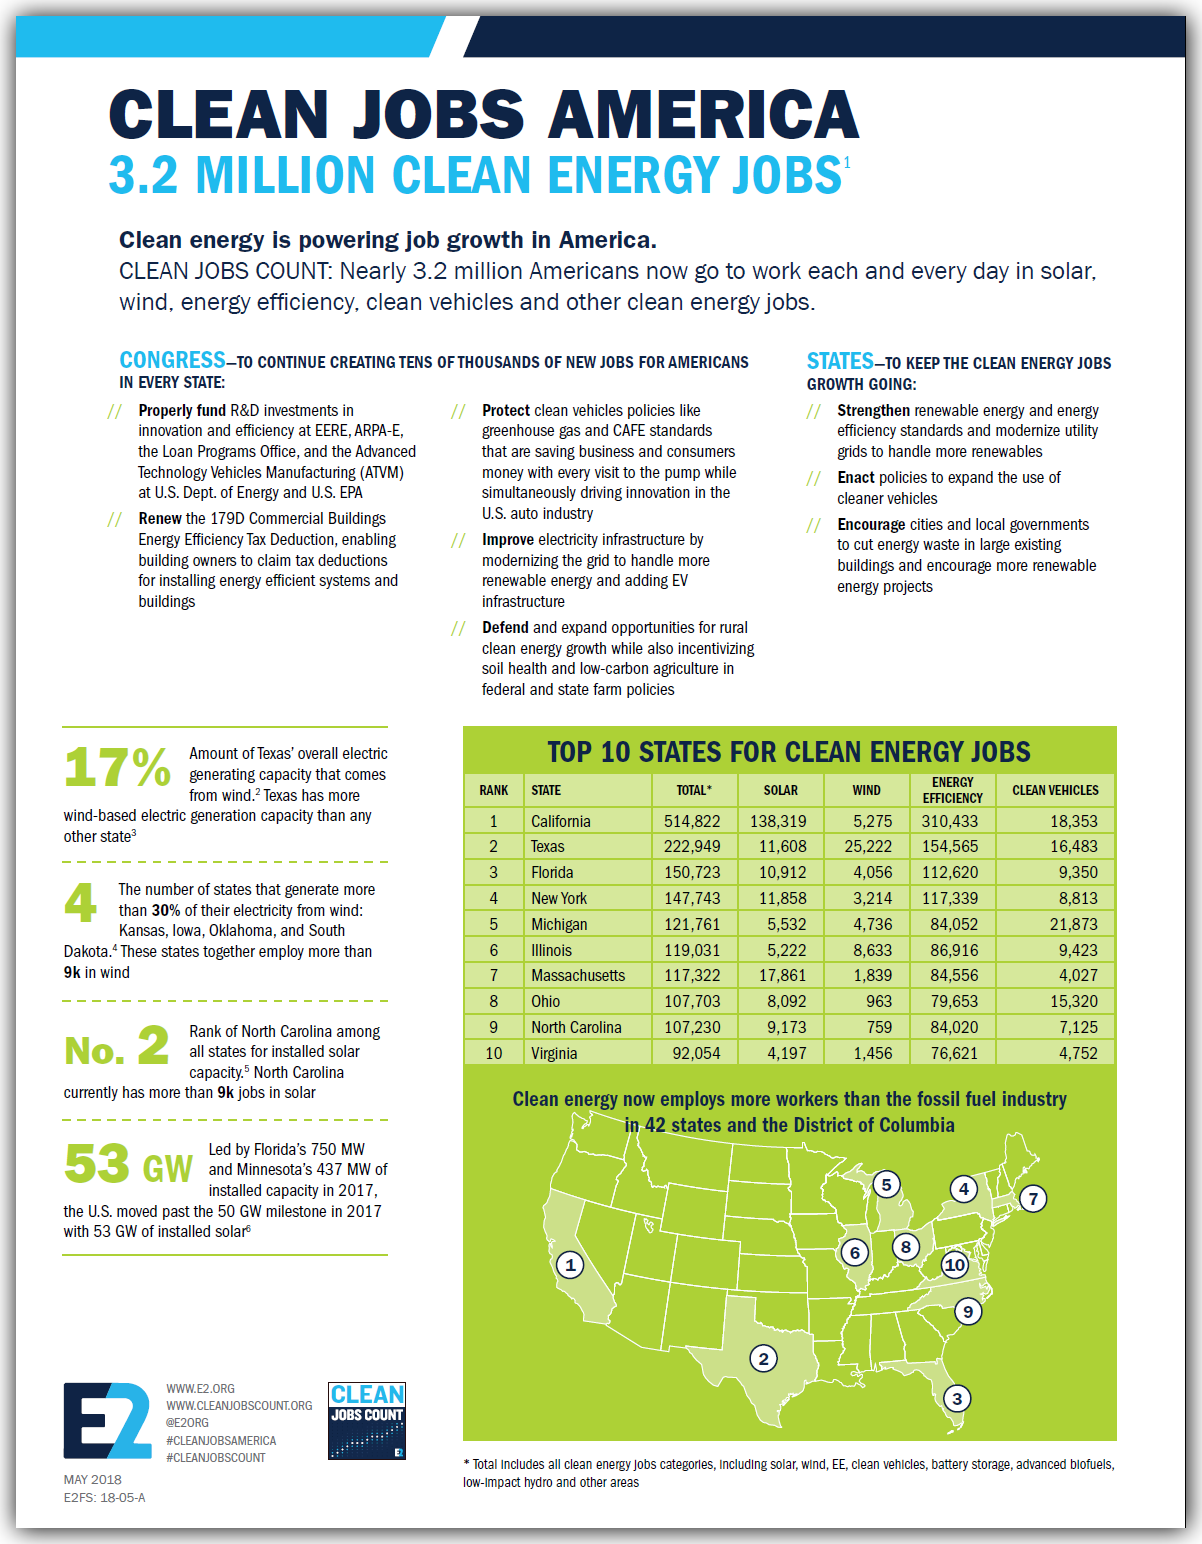 Clean energy is powering job growth in America. Clean jobs count: Nearly 3.2 million Americans now go to work each and every day in solar, wind, energy efficiency, clean vehicles and other clean energy jobs.
If you are looking for additional insight into E2’s Clean Jobs America or our other Clean Jobs America reports, visit e2.org/reports or see Clean Jobs Count for a full interactive jobs breakdown of every U.S. state and clean energy industry. You can also contact E2 Communications Director Michael Timberlake ([email protected]). An FAQ is also available here to answer any questions.
The complete report is available for download here.
View Report »Top 10 States: Calif, Texas., Fla., N.Y., Mich., Ill., Mass., Ohio., N.C., Va. Energy efficiency added the most new jobs in 2017 across all energy sectors More Americans now work in clean energy than in agriculture, real estate, investment banking, and the media and entertainment industries – combined. Growth in energy efficiency, battery storage and […]
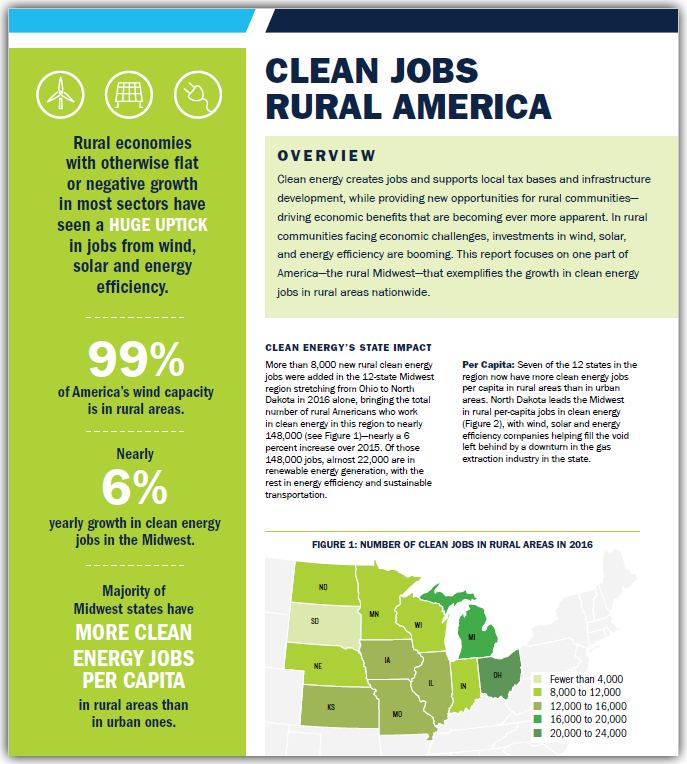
Clean energy creates jobs, supports local tax bases and infrastructure development, while providing new opportunities for farmers—driving economic benefits that are becoming ever more apparent. In rural communities facing economic challenges, investments in wind, solar, and energy efficiency are growing. This report from E2 focuses on one part of America – the rural Midwest – that exemplifies the growth in clean energy jobs in rural areas nationwide.
More than 8,000 new rural clean energy jobs were added in the 12-state Midwest region stretching from Ohio to North Dakota in 2016 alone, bringing the total number of rural Americans who work in clean energy in this region to nearly 148,000 (see Figure 1)—nearly a 6 percent increase over 2015. Of those 148,000 jobs, almost 22,000 are in renewable energy generation, with the rest in energy efficiency and sustainable transportation.

This report follows E2’s Clean Jobs America analysis which found the clean energy jobs account for nearly 3.3 million jobs across all 50 states and the District of Columbia. Both reports expand on data from the U.S. Energy and Employment Report (USEER) produced by the Energy Futures Initiative (EFI) in partnership with the National Association of State Energy Officials (NASEO), using data collected and analyzed by the BW Research Partnership. E2 is a partner on the USEER, the fourth installment of the energy survey first released by the Department of Energy in 2016. Clean energy jobs have grown every year since the first report was released in 2016.
If you are looking for additional insight into E2’s Clean Jobs Rural Midwest 2018 or our other Clean Jobs America reports, visit e2.org/reports. You can also contact E2 Communications Director Michael Timberlake ([email protected]). An FAQ is also available here to answer any questions.
The complete report is available for download at this link.
View Report »Clean energy employment represents a bright spot in rural communities that have otherwise lost population and jobs Growth in clean energy jobs outpacing overall hiring across Midwest (6%) Washington, DC – (May 10, 2018) – A new analysis from the national, nonpartisan business group E2 (Environmental Entrepreneurs) finds rural clean energy job growth is outpacing […]
Illinois’ clean energy economy is clearly thriving.
But where is all this economic activity happening?
That’s exactly what E2 — along with our partners at FracTracker Alliance — attempted to find out with this interactive map showing the location of more than 1,000 clean energy businesses across the state as well as sites where renewable energy is generated.
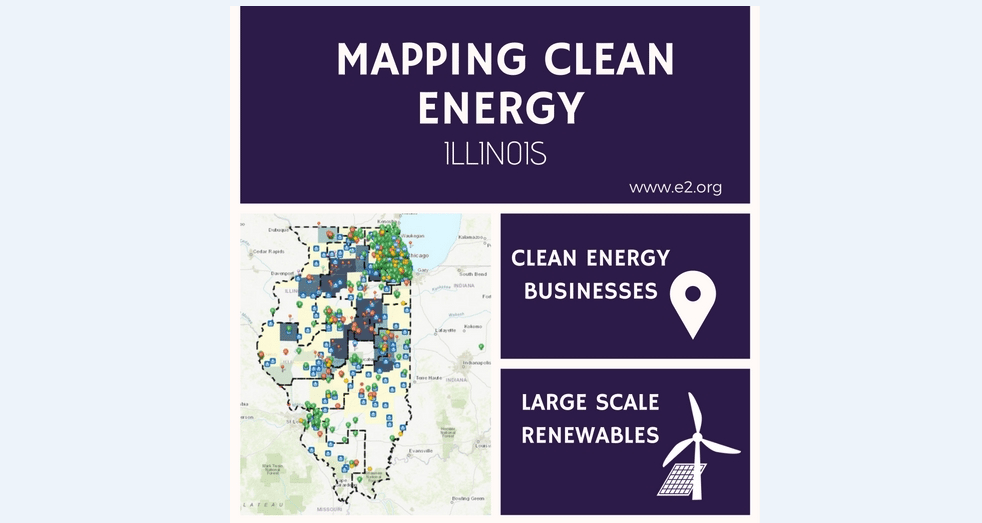
The purpose of this map is to help policymakers, press and individuals better understand the scope of Illinois’s clean energy economy – and how much room it has to grow.
We’ve done our best to capture as many businesses as possible but we know we’ve missed some. This map isn’t comprehensive; it represents one snapshot in time of an industry to show how robust it is. If you know we’ve missed something, please send an email to Micaela Preskill at [email protected] and we’ll add it to the map.
When viewing the map, zoom in to see the intricacies of what’s happening in each part of the state. If you click “Layers” on the black bar at the top of the map you will see a drop-down menu, which you can use to make data appear or disappear on the map.
For more information about what you’re seeing, click directly on the map. A pop-up box will appear to show you specifics. Use the arrows on the top right of the pop-up box to see all the information that applies to that spot on the map. For example, if you click on a pin representing a energy efficiency contractor, you’ll see information about that business. You can also use the arrow to see what legislative districts that business is in.
Illinois supports 119,395 clean energy jobs – 2017 Clean Jobs Midwest Report
Over 3 million Americans work in clean energy – Clean Jobs America
Michigan’s clean energy economy is clearly thriving.
But where is all this economic activity happening?
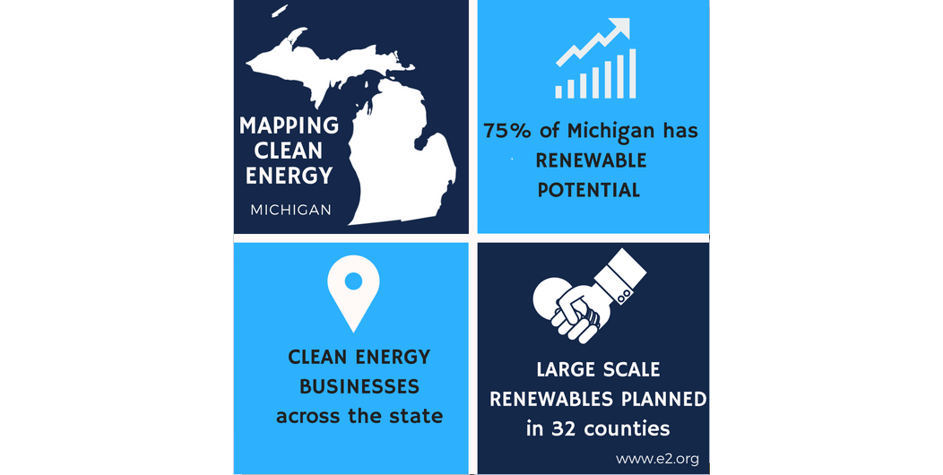
That’s exactly what E2 — along with our partners at FracTracker Alliance — attempted to find out with this series of interactive maps showing the location of more than 1,200 clean energy businesses across the state as well as sites where renewable energy is generated.
 Since Michigan passed legislation in 2008 requiring utilities to generate 10% of their electricity from renewables by 2015, we’ve seen the state’s clean energy economy grow. Then in December of 2016 lawmakers decided to uphold and improve aspects of the state’s clean energy standards. The renewable portfolio standard was increased and new energy efficiency incentives were created to push utilities to do more. With recently strengthened laws, it is no surprise that Michigan’s clean energy sector – as seen on this series of maps – is so robust.
The purpose of these maps is to help policymakers, press and individuals better understand the scope of Michigan’s clean energy economy – and how much room it has to grow.
We’ve done our best to capture as many businesses as possible but if you know we’ve missed something, please send an email to Micaela Preskill ([email protected]) and we’ll add it to the map. This map isn’t comprehensive; it represents one snapshot in time of an industry to help you understand just how robust it is, and where it still has room to grow.
We’ve created 3 maps to show different parts of Michigan’s clean energy economy. One map shows clean energy businesses, one shows renewable energy utility-scale infrastructure, and one shows renewable energy potential.
When viewing the map, zoom in to see the intricacies of what’s happening in each part of the state. If you click “Layers” on the black bar at the top of the map you will see a drop-down menu, which you can use to make data appear or disappear on the map.
For more information about what you’re seeing, click directly on the map. A pop-up box will appear to show you specifics. Use the arrows on the top right of the pop-up box to see all the information that applies to that spot on the map. For example, if you click on a pin representing a energy efficiency contractor, you’ll see information about that business. You can also use the arrow to see what legislative districts that business is in.
The Clean Energy Business Map shows locations of energy efficiency contractors and solar, wind and geothermal installers.
The Renewable Energy Infrastructure Map shows utility-scale wind and solar generation facilities larger than 1 MW and schools with solar energy generation.
The Renewable Potential Map shows the potential for wind, geothermal and solar power generation.
Clean Jobs Count to hold events across the country in 2018 Major digital ad campaigns running in numerous states New state factsheets and reports will detail clean energy employment by county, congressional and legislative district Washington, DC – (May 8, 2018) – With the Trump administration enamored with coal, oil and gas, and with clean […]
• Applications now being accepted for emerging business leaders who want to advance environmental, clean energy policies at state and federal level • Winning applicants to receive $20,000 grants, mentoring from seasoned executives and entrepreneurs WASHINGTON, DC (May 8, 2018) – 1 Hotels, a mission-driven, nature-inspired luxury lifestyle brand with locations in Manhattan, Brooklyn and […]
Colorado is at a crossroads – emissions from transportation is about to overtake the electricity sector, even as Pruitt’s EPA wants to roll back the national clean car standards. Yet we are poised to take action. Governor Hickenlooper joined the Climate Alliance with other states, pledging Colorado to follow the Paris Agreement. In July 2017, the Governor […]
1 Hotels Fellowship at E2 launches second year of initiative to support emerging leaders who want to advance federal and state clean energy policies Winning applicants to receive $20,000 grants, mentoring from seasoned executives and entrepreneurs WASHINGTON, DC (May 3, 2018) – 1 Hotels and the national, nonpartisan business group E2 (Environmental Entrepreneurs) announced today that applications […]