Clean Jobs Oregon 2018
OREGON POISED TO BUILD ON CLEAN ENERGY SUCCESS IN 2019
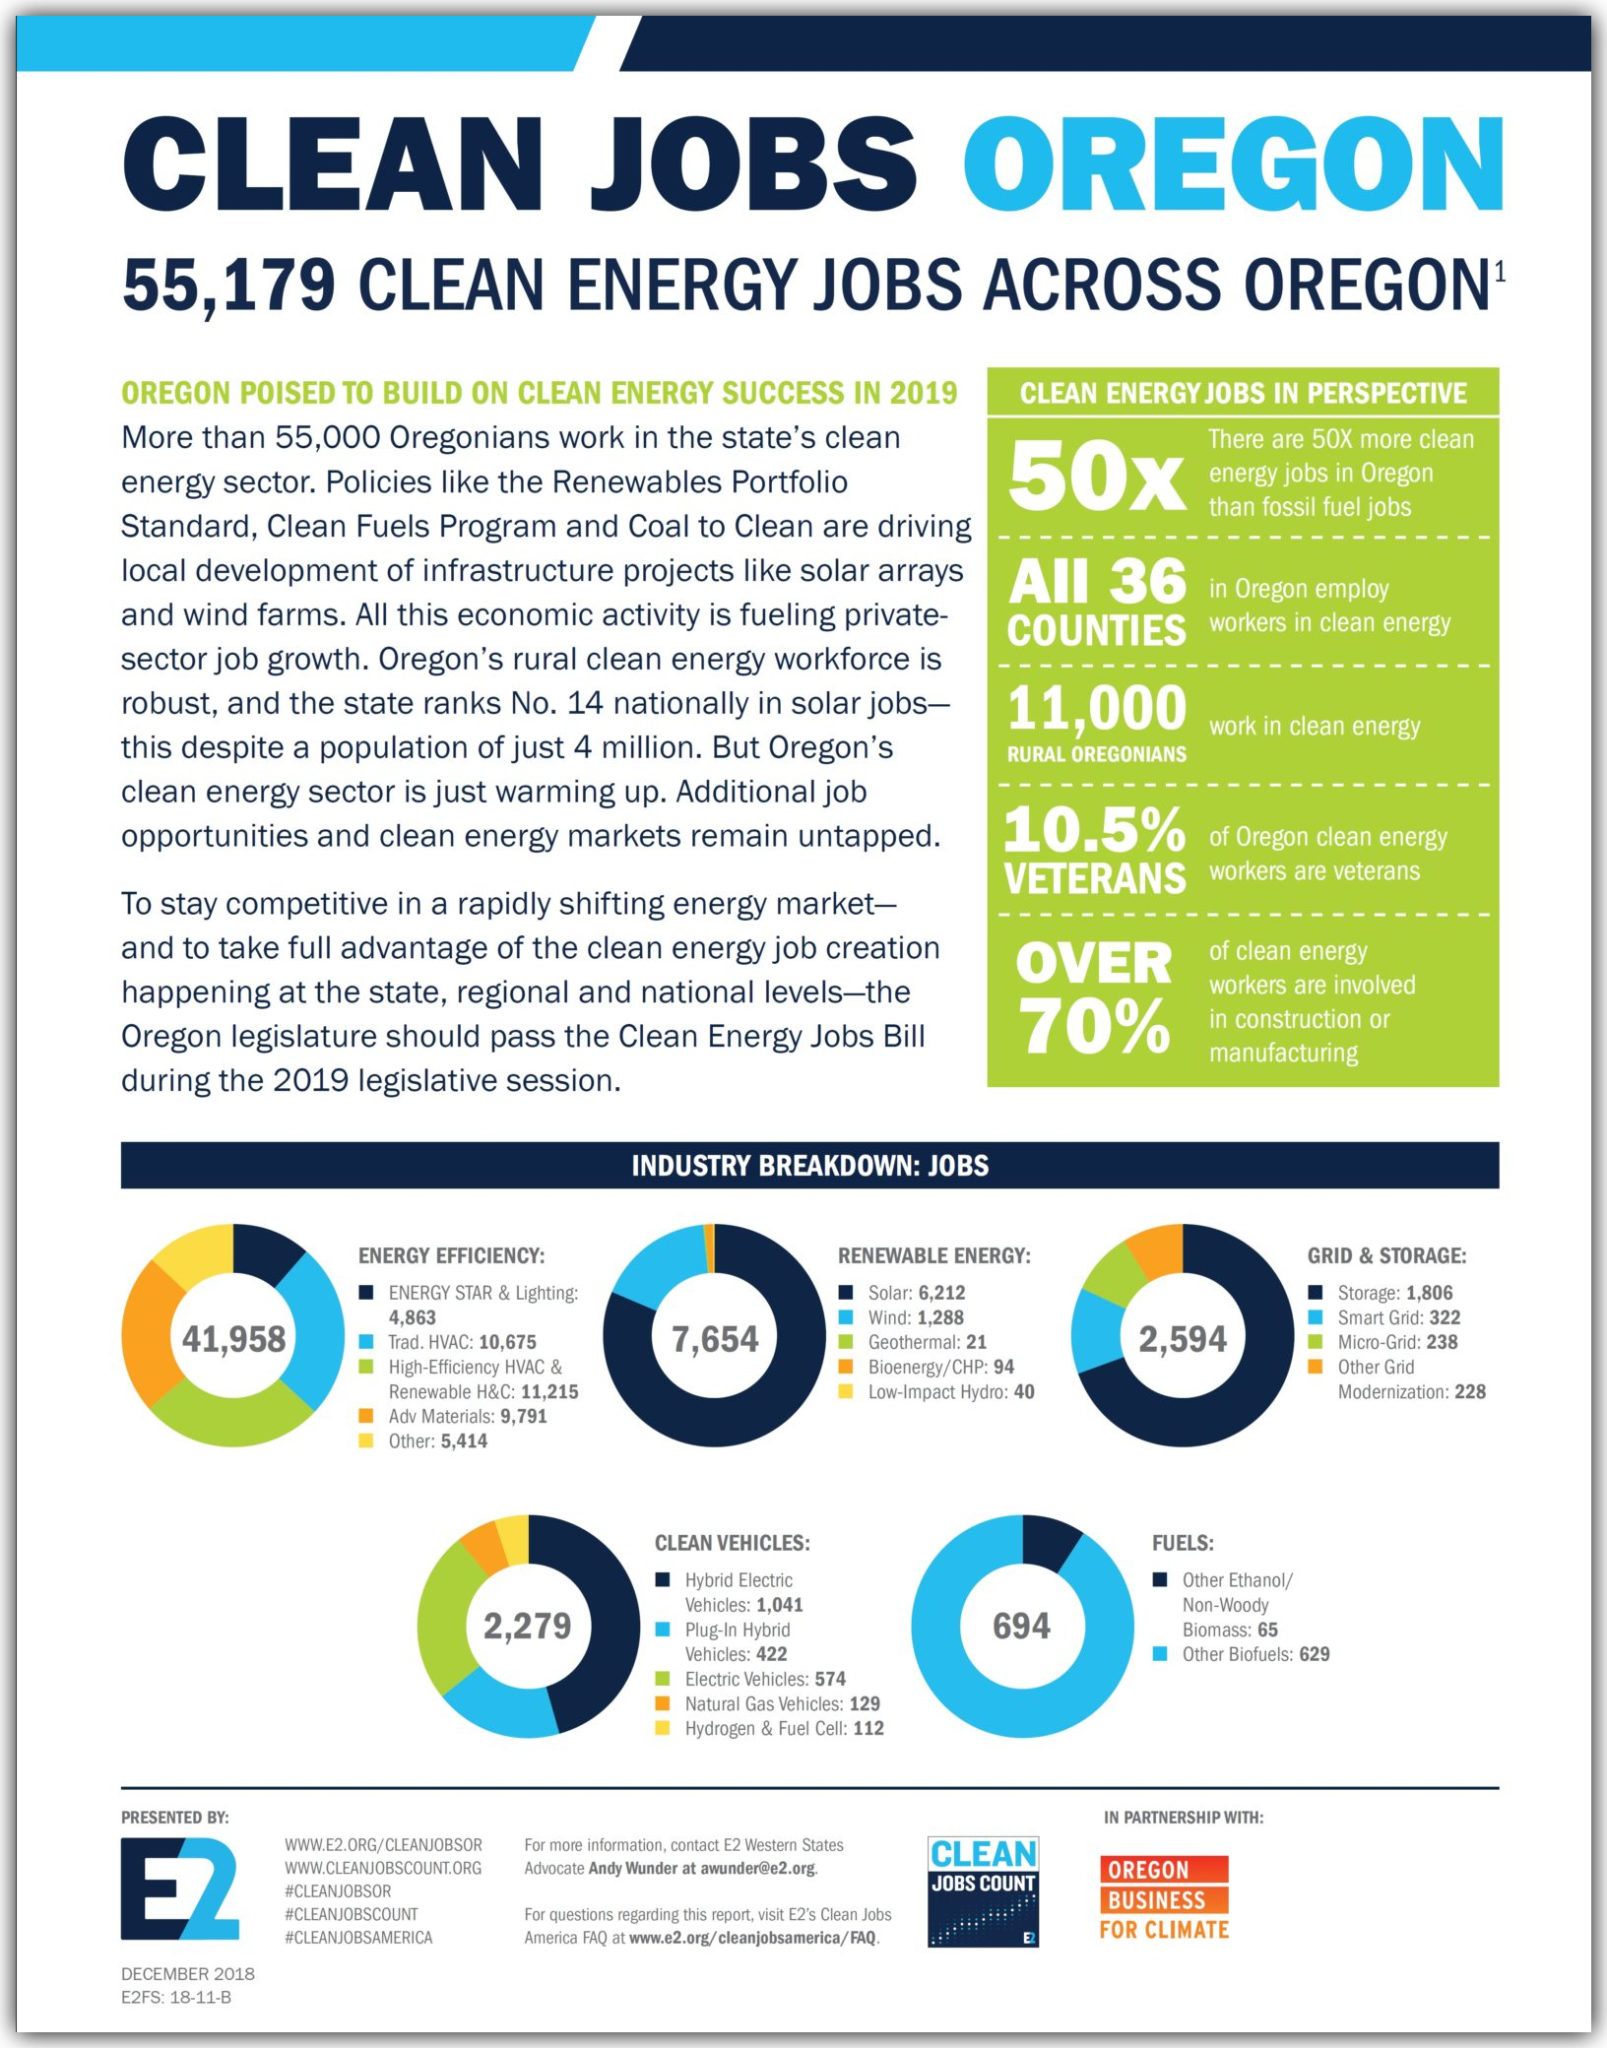 More than 55,000 Oregonians work in the state’s clean energy sector. Policies like the Renewables Portfolio Standard, Clean Fuels Program and Coal to Clean are driving local development of infrastructure projects like solar arrays and wind farms. All this economic activity is fueling private-sector job growth. Oregon’s rural clean energy workforce is robust, and the state ranks No. 14 nationally in solar jobs—this despite a population of just 4 million. But Oregon’s clean energy sector is just warming up. Additional job opportunities and clean energy markets remain untapped.
To stay competitive in a rapidly shifting energy market—and to take full advantage of the clean energy job creation happening at the state, regional and national levels—the Oregon legislature should pass the Clean Energy Jobs Bill during the 2019 legislative session.
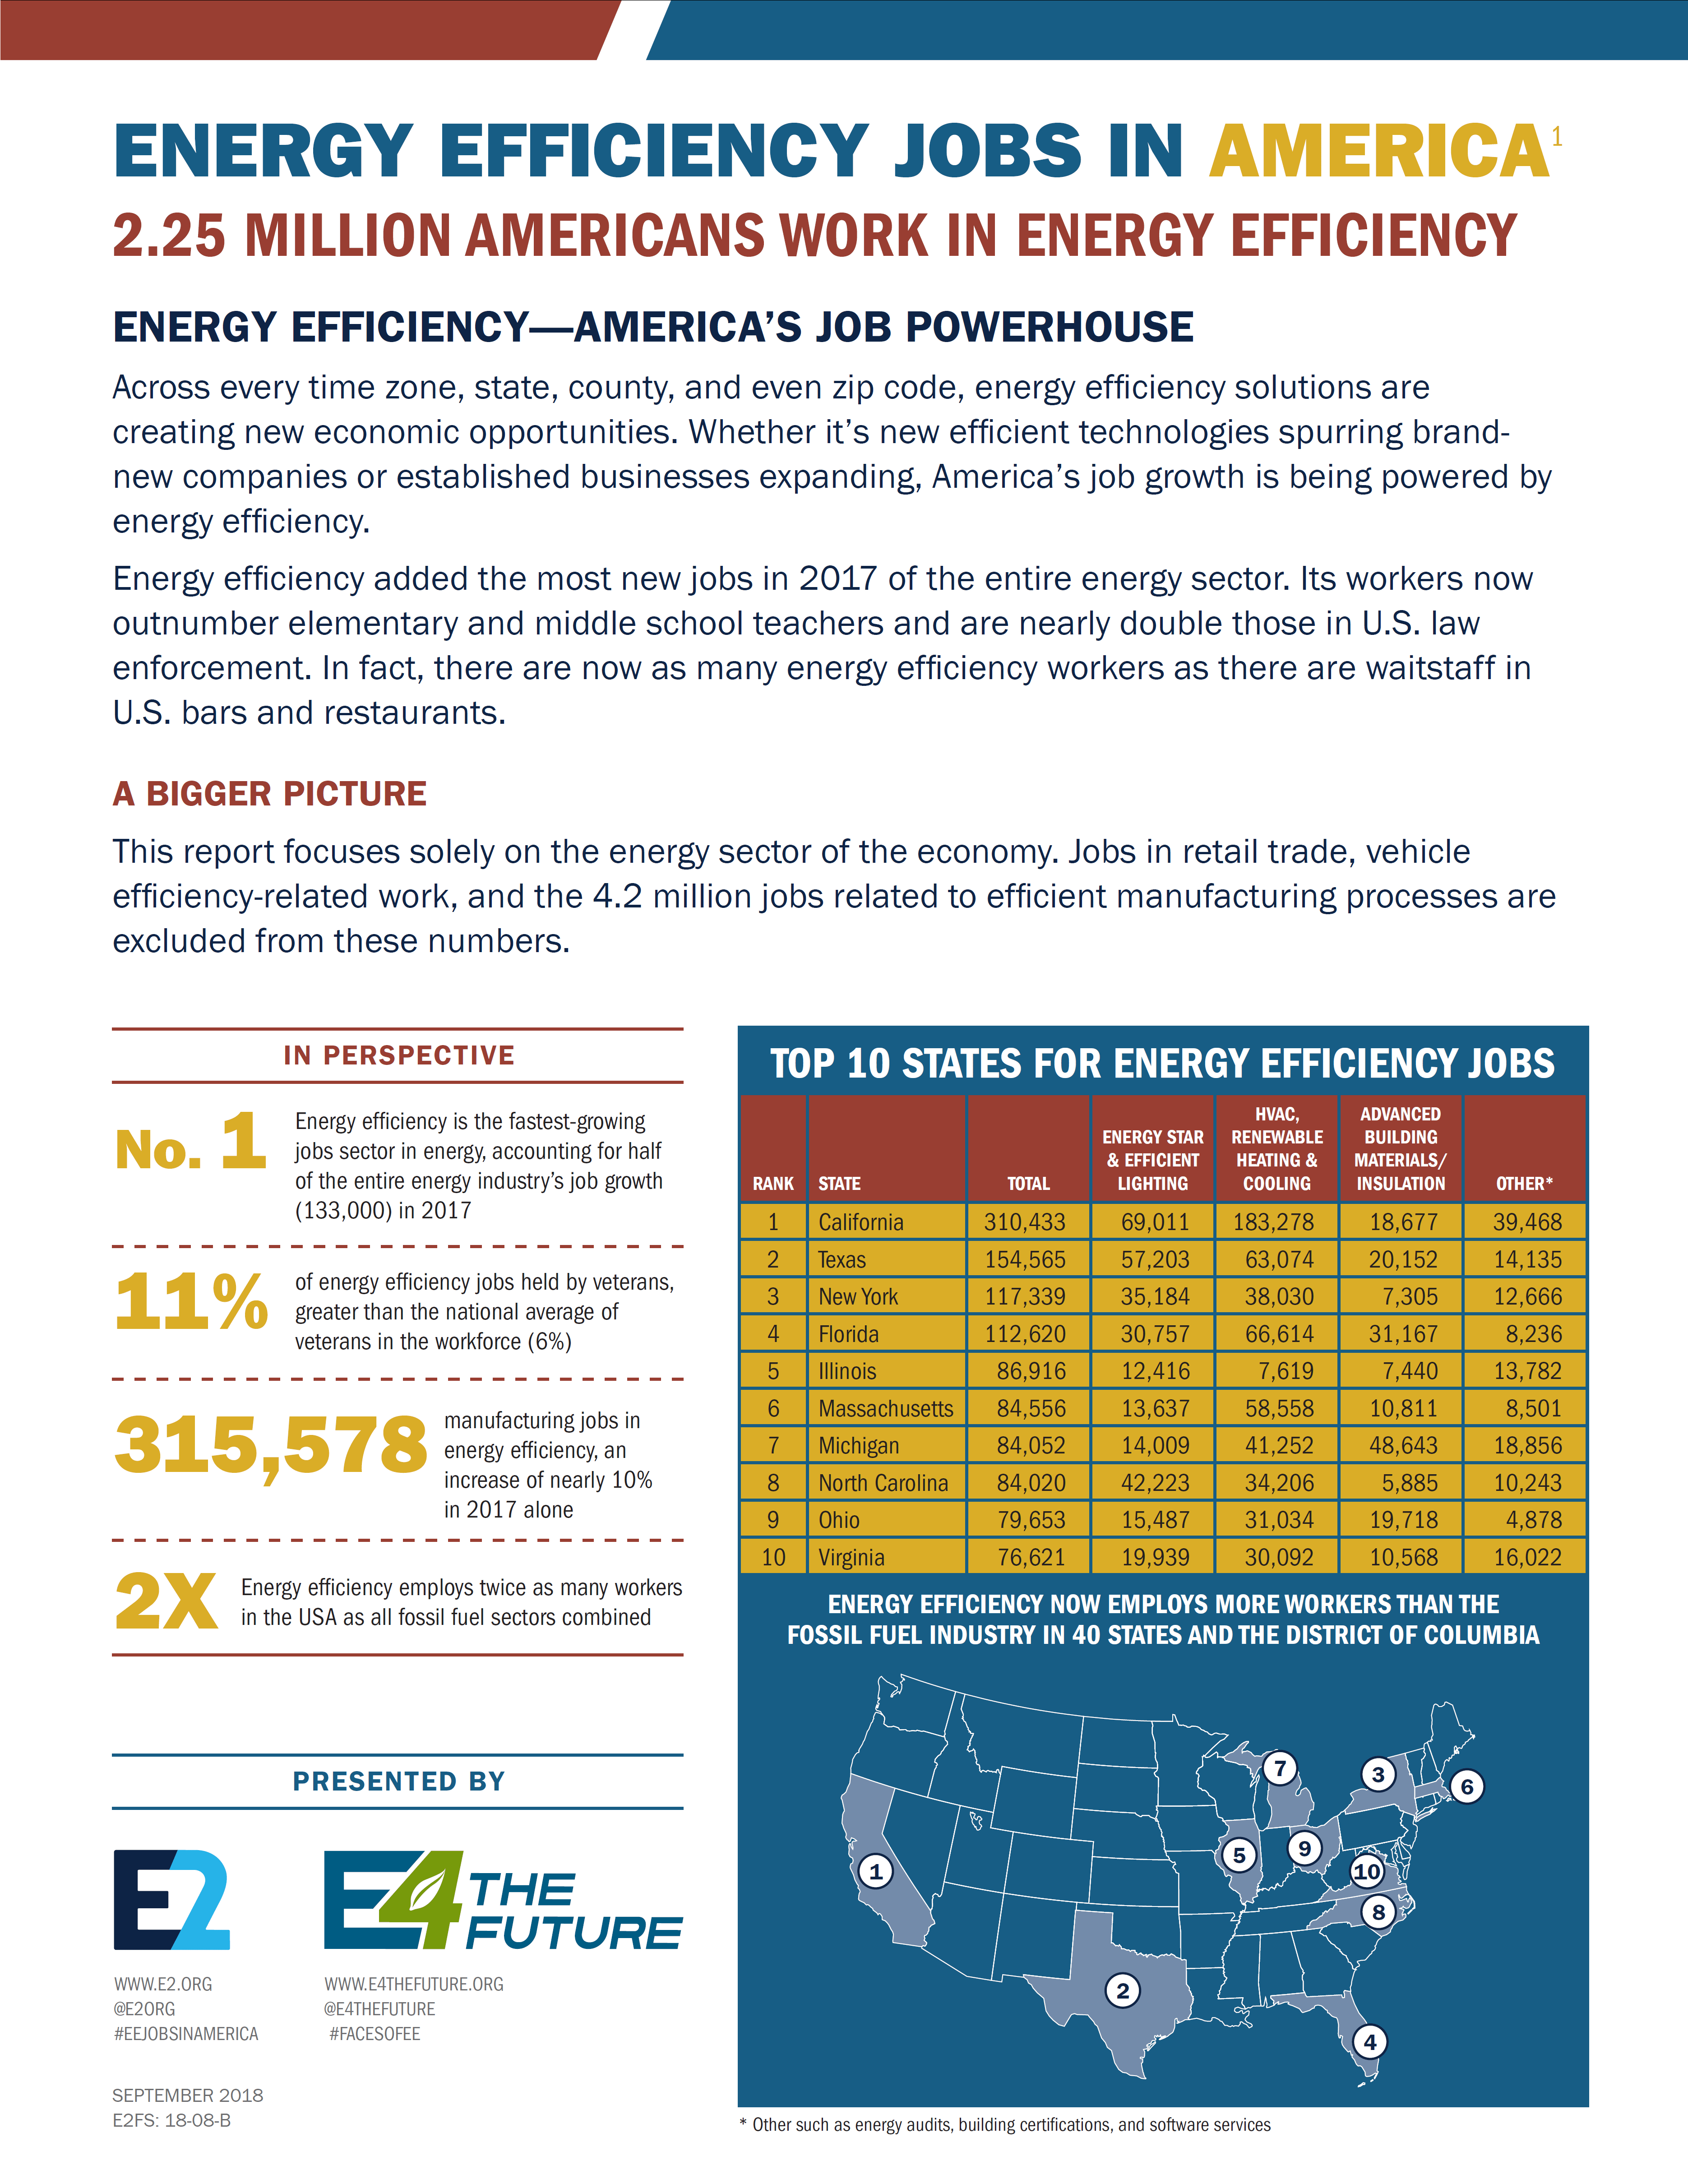
A BIGGER PICTURE
This report focuses solely on the energy sector of the economy and does not include jobs in retail trade, repair services, water or waste
management, and indirect employment or induced employment.
HIGHLIGHTS:
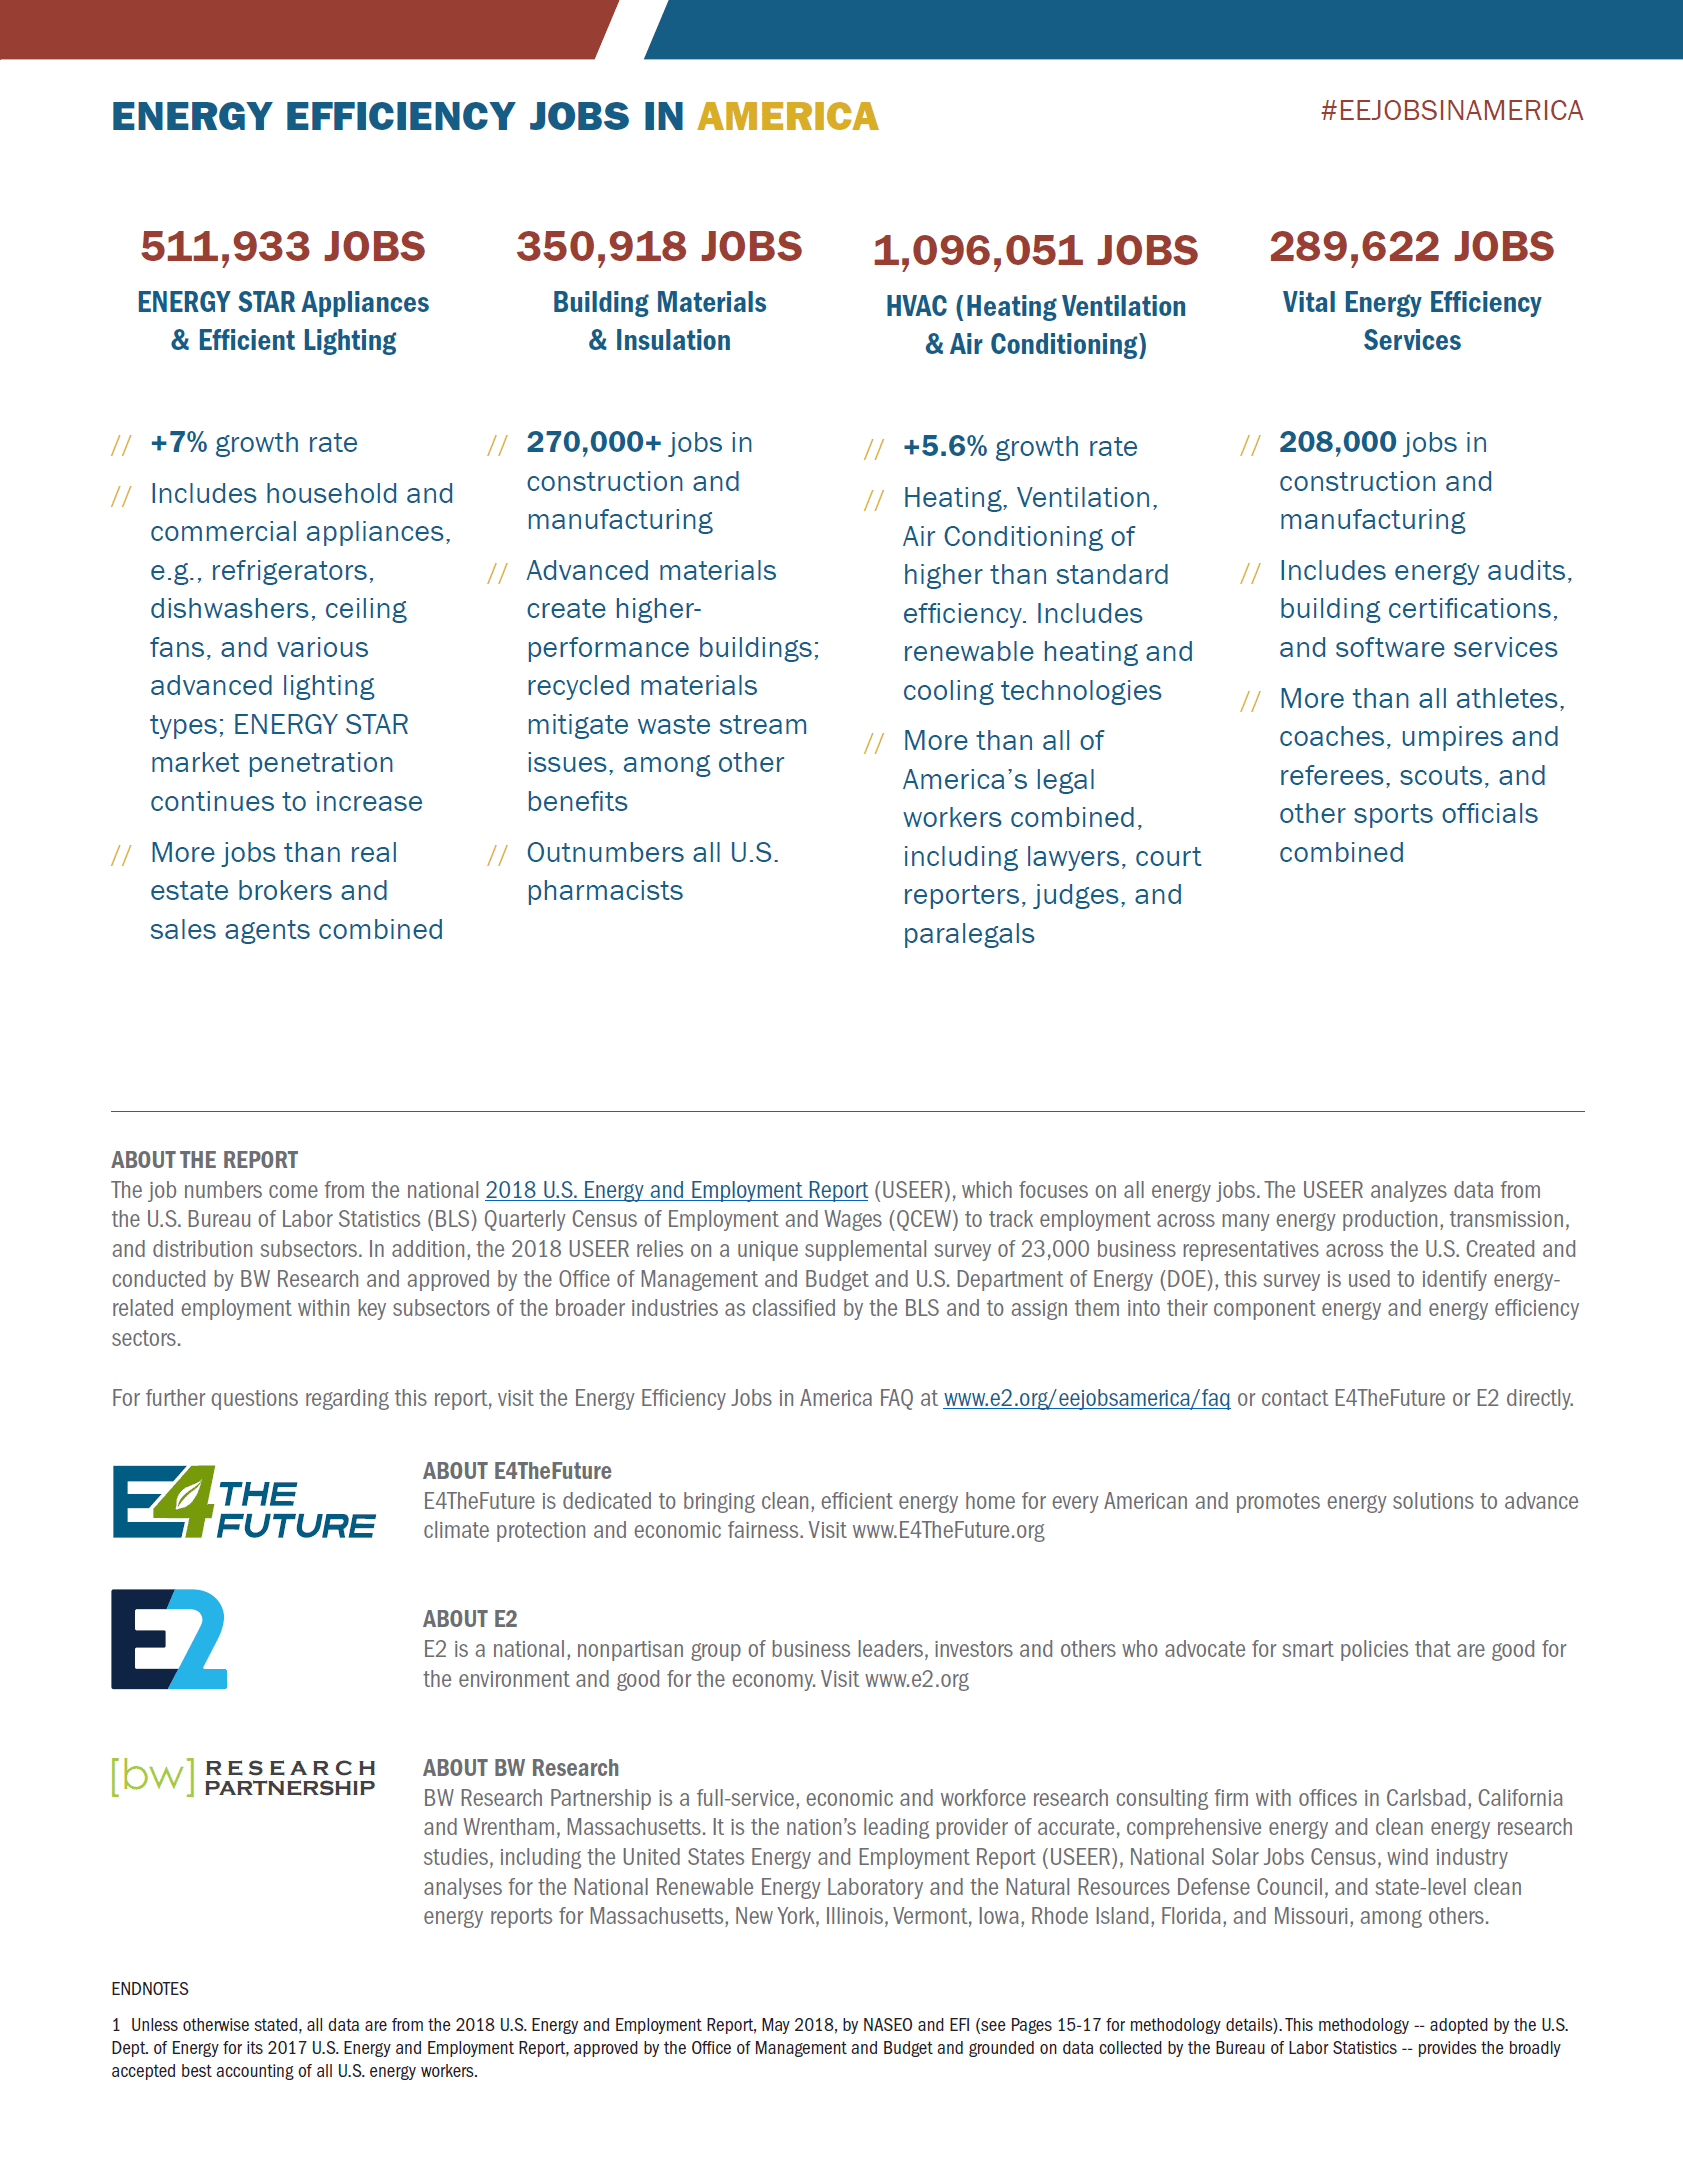
- Energy Efficiency Jobs – 41,958
- Renewable Energy Jobs – 7,654
- Solar Jobs – 6,212
- Wind Jobs – 1,288
- Energy Storage Jobs – 2,594
- Clean Vehicle Jobs – 2,279
- TOTAL Oregon Clean Energy Jobs – 55,179
LOOKING FOR MORE INFO?
For an even deeper dive into the breakdown of clean energy jobs for Oregon visit E2’s District-By-District Clean Energy Jobs in Oregon page for factsheets on jobs in every Oregon state legislative district.
Visit e2.org/reports or see Clean Jobs Count for a full interactive jobs breakdown of every U.S. state and clean energy industry. You can also contact E2 Communications Director Michael Timberlake ([email protected]). An FAQ is also available here to answer any questions.
DOWNLOAD
The complete report is available for download here.
View Report »


 If New York, New Jersey, Virginia, North Carolina, and South Carolina added an average-sized offshore wind energy farm (352 MW), nearly 25,000 jobs and $3.6 billion would be added to the states’ economies.