Mapping Clean Energy: Pennsylvania

Date: September 26, 2016

E2’s Pennsylvania Clean Energy Map shows the location of clean energy businesses across the state as well as sites where renewable energy is generated.

The purpose of the map is to help policymakers, press and individuals better understand the scope of Pennsylvania’s clean energy economy – and how much room it has to grow.

Here’s the map:


Rural areas hubs of clean energy activity

As our map shows, as of June 2016 Pennsylvania had more than 2,500 megawatts (MW) of renewable energy capacity from solar, wind and small hydroelectric plants.

Of that capacity, about half – or 1,300 MW – comes from wind, while nearly 1,000 MW comes from small hydroelectric plants. The remaining 240 MW comes from solar photovoltaic (PV) projects – i.e., the solar panels that you see on rooftops and in fields.

The majority of clean energy businesses are located in the Philadelphia and Pittsburgh metro areas and surrounding counties. However, as the map shows, less-urban counties actually have the most renewable energy generating capacity.

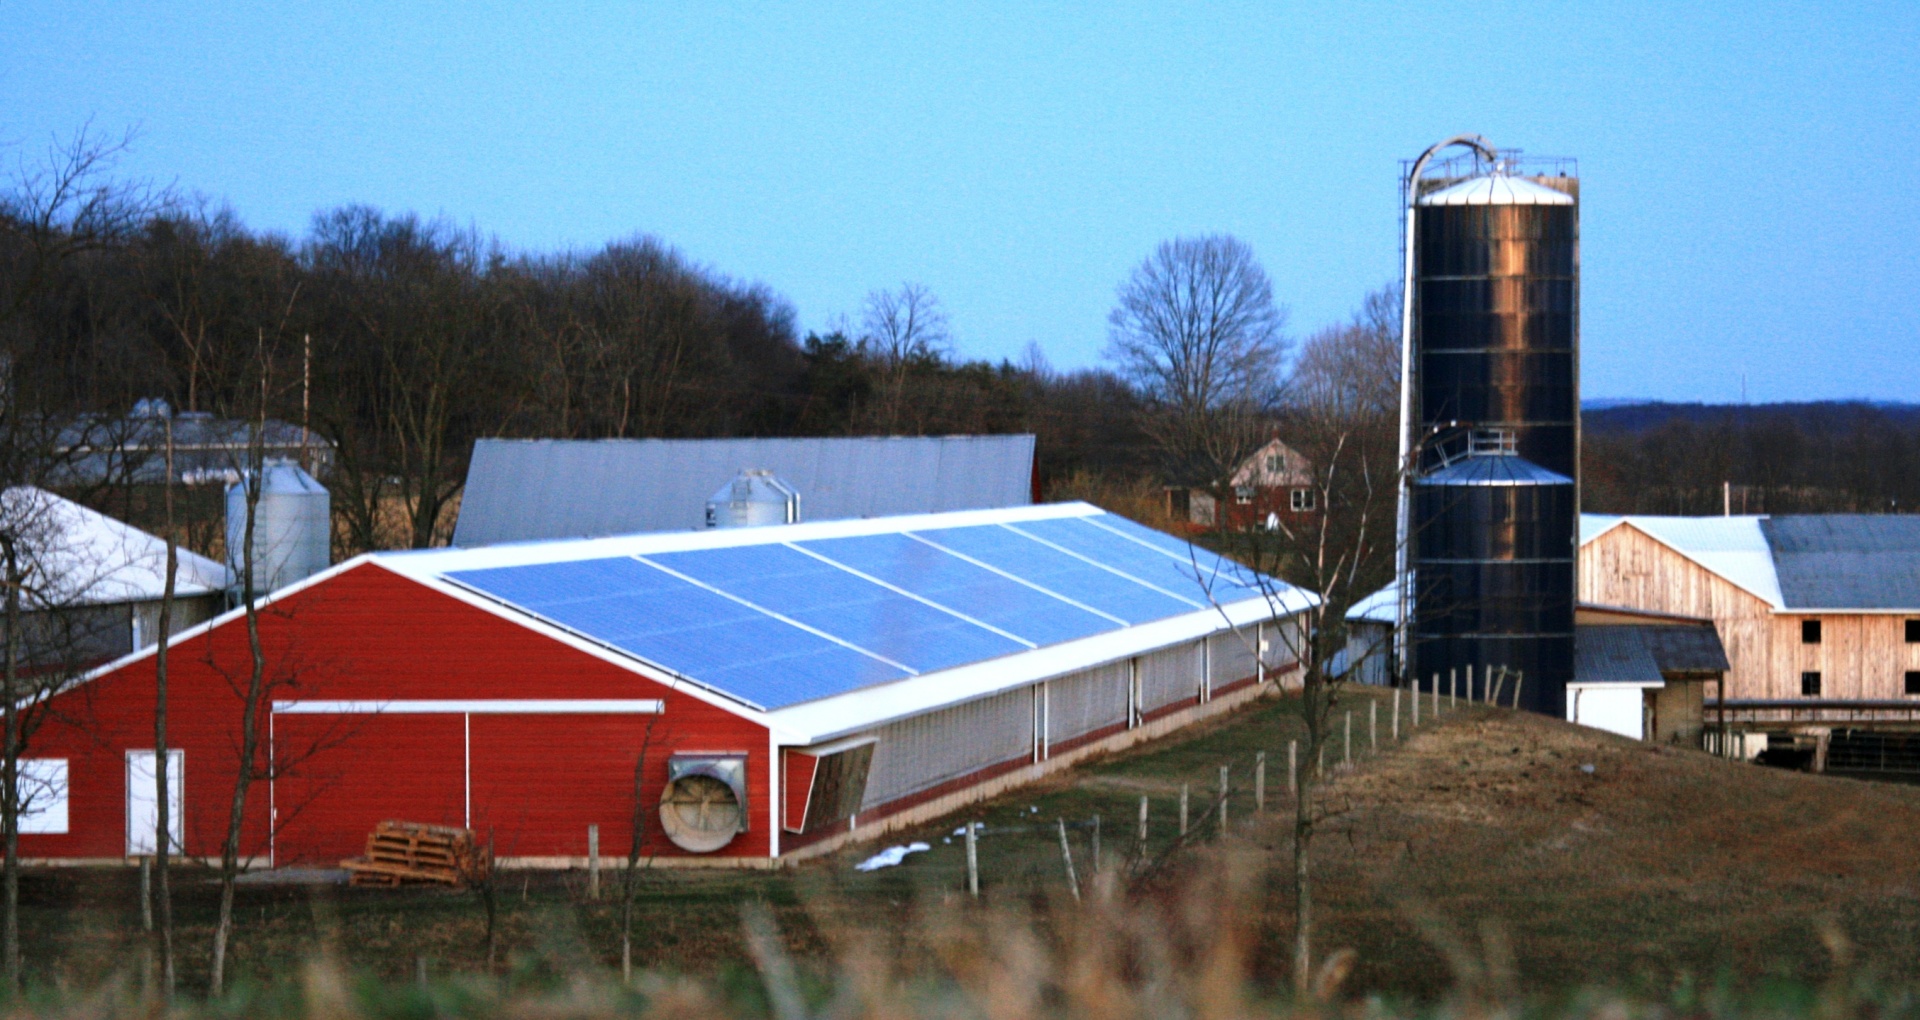
For example, Lancaster County has the largest renewable energy generating capacity in the state, with 720-plus MW. Lancaster County is a solar leader. Its 1,000 solar systems and its nearly 50 MW of solar PV power generating capacity are both tops in the state, mainly due to the large number of farms now using solar energy.

Chester County is the state’s No. 2 solar county with more than 800 solar systems and 21 MW of generating capacity.

Cambria County’s Highland Wind Farm was developed on an old strip mine. (Photo courtesy of EverPower Wind Holdings)


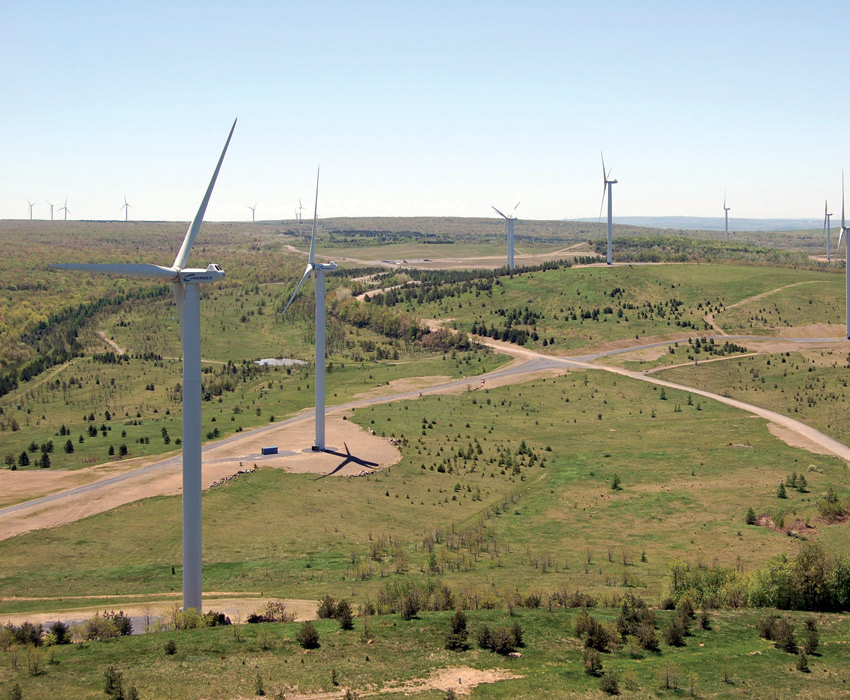
Further west, Somerset and Cambria counties are Nos. 2-3 when it comes to overall renewable energy generating capacity, with 360-plus MW and about 250 MW, respectively. Both rely on wind for most of their renewable energy capacity.

The 62.5 MW Highland Wind Farm in Cambria County, for example, was brought online in 2009 by EverPower Wind Holdings. Situated on a reclaimed strip mine, nine full-time workers maintain and operate its 25 turbines.


Top 10 counties in PA for renewable energy generation

Ranking County Total Renewable Generation (MW)
1 Lancaster 774
2 Somerset 364
3 Cambria 248
4 Blair 157
5 Schuylkill 148
6 Wyoming 143
7 Bucks 130
8 Fayette 103
9 Tioga 101
10 Delaware 84


At Focus Farm, a turkey farm in Lewisburg, a rooftop solar array installed by Energy Independent Solutions helped create jobs in a rural part of Central Pennsylvania. (Photo courtesy of EIS Solar)


6,000 clean energy businesses in Pennsylvania

As outlined in E2’s “Clean Jobs PA” report, there are 66,000 clean energy jobs at nearly 6,000 clean energy businesses in Pennsylvania. This was based on data collected from the U.S. Bureau of Labor Statistics and from a BW Research Partners survey of hundreds of Pennsylvania companies.


Map user’s guide

  • When viewing the map, note the “Layers” option on the black bar at the top of the map. Click the drop-down menu to select different layers of information. When a layer is selected, a description of that layer is displayed in the left-hand column.
  • The Clean Energy Businesses layer shows locations of businesses involved in the solar, energy efficiency, geothermal, and “other” sectors. See “Registry” for the types of businesses included. When clicking the icon on the map, the user can view information about that particular business.
  • The Utility-Scale Renewable Energy Facilities layer shows utility-scale wind, solar and hydroelectric generation facilities larger than 1 MW. This information is derived from the U.S. Energy Information Agency, retrieved July 2016. [Source: http://www.eia.gov/maps/layer_info-m.cfm, Power Plants data set, last updated 7/7/2016]
  • The Commercial and Residential PV Systems layer shows 7,035 commercial and residential solar PV generation facilities. To protect the privacy of individual home and business owners, the icons are randomly placed within the zip code region of each address. Exact addresses for these locations are not shown, and when the map is enlarged, these icons disappear.
  • [Note: Data for the Commercial and Residential PV Systems Data layer was retrieved from a Right-to-Know Request from the Pennsylvania Department of Environmental Protection by the Mid-Atlantic Renewable Energy Association (MAREA) of all the solar PV systems that received Pennsylvania Sunshine Grant money through the closure of that program in December 2013. As of June 28, 2016, there were 8,518 solar PV systems in Pennsylvania registered with PJM, so almost 1,500 of these systems do not appear on the map because their locations are not available.]
  • State and House Districts layers outline Pennsylvania state legislative districts.


More about the map

The Clean Energy Map of PA includes companies from E2’s jobs report survey. The map also includes data from Conservation Service Providers registered with the Pennsylvania Public Utility Commission to provide services under Act 129, as well as data obtained via internet searches of clean energy companies throughout the state.

The map is a dynamic, “living” tool. It will continually capture and update information on companies helping expand Pennsylvania’s clean energy economy. Every month, we add clean energy companies to the map. (However, it is important to note that we do not endorse or vet companies that choose to be included in the map.)

Partners:


e2_logo

marea-logo Print


View Report »

Oregon: Changing Climate, Economic Impacts, & Policies for Our Future

Date: July 25, 2016

“Oregon: Changing Climate, Economic Impacts, and Policies for our Future” is a first-of-its-kind resource for businesses, entrepreneurs, and policymakers. In addition to examining the economic threat climate change poses to Oregon, the report highlights the economic benefits and job opportunities that can be created by deploying more clean energy.

View Report »

Clean Jobs Pennsylvania 2016

Date: July 14, 2016

To better understand how clean energy is creating jobs in the Keystone State and to examine what policies are needed now to support future job growth, Clean Jobs Pennsylvania analyzes the size and scope of the state’s clean energy economy. Relying on databases and survey data from Pennsylvania employers, this comprehensive report found that the clean energy sector in Pennsylvania in 2015 employed more than 66,000 workers at 5,900 businesses and establishments.

Overall Clean Energy Jobs

The clean energy industry—which in this report includes energy efficiency, renewable energy, alternative transportation and greenhouse gas (GHG) management and accounting—is a source of good jobs for tens of thousands of Pennsylvanians.

In 2015, Pennsylvania’s clean energy industry supported 66,021 workers at 5,900 businesses and establishments according to E2 and the Keystone Energy Efficiency Alliance’s (KEEA) 2016 Clean Jobs Pennsylvania report. Four out of five of these jobs are in energy efficiency. To grow the clean energy sector even more, state and federal lawmakers can strengthen policies like Act 129, the state’s renewable energy law, and implement the Clean Power Plan in a way that prioritizes renewables and energy efficiency.

Energy efficiency industries led the clean energy sector in job growth last year, increasing from 37,000 jobs to 53,000 jobs. These gains in energy efficiency employment helped boost the overall number of clean energy jobs in Pennsylvania by more than 8,700 workers between 2014-2015, despite job declines in clean fuels and other areas. Renewable energy jobs increased slightly to more than 8,800 jobs, reflecting growth in the wind, solar, and low-impact hydro-electric industries. The bioenergy industry shed about 2,000 jobs, which mirrors a national slowdown trend in the technology. Companies in the state are bullish on the industry’s future. More than half project hiring more employees in 2016.

This represents about 1 percent of total state employment. It also represents a 15 percent increase over the number of clean energy jobs in the state in 2014, nearly doubling the predicted growth rate E2 identified in our previous Clean Jobs Pennsylvania report. Clean energy businesses across the state say they anticipate growth to continue. More than half of the businesses surveyed expect to add jobs in the upcoming year, with only 3 percent expecting to cut jobs.

DOWNLOAD

The complete report is available for download at this link or by clicking the cover of the report above.

View Report »

Clean Jobs New York 2016

Date: May 2, 2016

CleanJobsNY_Cover

A comprehensive analysis of clean energy jobs in New York

E2 and our partners recently released Clean Jobs New York, a comprehensive report showing that more than 85,000 people work in the clean energy sector in New York at more than 7,500 business establishments.

The report is available here and you can also search for clean energy jobs in your home county with this dynamic, searchable dashboard.

The campaign’s new website is here.

The press release for the report is here,the press release for the New Yorkers for Clean Power campaign is available here, and press coverage of the report is available here.

By looking  at the size and scope of the state’s clean energy economy, Clean Jobs New York helps stakeholders better understand how clean energy is creating jobs — and what policies are needed now to support further gains in the future.

A few of the report’s key findings include:

  • Clean energy employs 85,197 people at 7,500 business establishments statewide. Energy efficiency is the largest industry in the sector, employing four out of five clean energy workers in New York.
  • Clean energy businesses anticipate growing more than 6 percent this year. That’s more than double the growth rate of the entire U.S. economy in 2015.
  • Clean energy knows no politics. Clean energy jobs are growing in legislative and congressional districts across the state. With the right policies from Albany and Washington, D.C., even more jobs can be created all across New York.

Sharable graphics for use on social media and blogs are available here: Report Cover, Overall Numbers, County Map, Energy Efficiency, and Renewables.

Actor and climate change advocate Mark Ruffalo with E2 New York chapter directors. (E2 photo)

To learn more about Clean Jobs New York, please contact Ying Li at [email protected] or Jeff Benzak at [email protected].

To find out more about E2’s New York chapter, please see here.

View Report »

Clean Jobs America 2016

Date: March 29, 2016

More than 2.5 million Americans work in clean energy nationwide, according to a comprehensive analysis of U.S. clean energy jobs. Energy efficiency, renewable energy and advanced vehicles were the clean energy industries with the most workers.

View Report »

Clean Jobs Quarterly | Q4 and Year-in-Review

Date: February 11, 2016

2015 was a big year for clean energy policy, with the finalization of the federal Clean Power Plan, which sets the first-ever limits on carbon pollution from power plants; an international agreement at the UN climate talks near Paris; extension of key federal tax incentives for wind and solar electricity; and major investments in clean energy by business leaders.

View Report »

Climate Change

The economic costs of climate change continue to add up with every wildfire, drought, flood and mega-storm. The economic benefits and opportunities of acting on climate change and expanding clean energy also are growing every day. E2 and its members work to advance smart climate policies at the state, federal and international levels – because […]

Clean Jobs Quarterly | Q3 2015

Date: November 12, 2015

In the third quarter of 2015, 34 clean energy and clean transportation projects were announced across 22 states. Combined, these projects are expected to create just shy of 10,000 jobs, with solar once again the top sector. Utah, California, and Colorado led the nation in job announcements, followed by Texas, Arizona, Georgia, Maine, Nebraska, Mississippi, and North Dakota. Since E2 began tracking jobs in 2012, more than 250,000 clean energy and clean transportation jobs have been announced.

View Report »

Clean Jobs Quarterly | Q2 2015

Date: September 3, 2015

In the second quarter of 2015, nearly 40 clean energy and clean transportation projects were announced across 22 states. Combined, these projects are expected to create nearly 10,500 jobs.

Texas, Nevada, and California led the nation in announced jobs, followed by Utah, North Carolina, Kansas, Arkansas, Colorado, Virginia, and Nebraska. In Texas, solar and wind installation projects drove the state’s top performance.

Two new wind farms will cumulatively produce 402 MW of power from wind turbines in the Lone Star State, while Spanish wind manufacturer GRI Renewable Industries will create 300 jobs with a new wind turbine manufacturing plant in Amarillo. Three solar farms will add another 320 MW of Texas power and could create up to 1,364 jobs in Windthorst, Floyd, Andrews, and Pecos counties.

View Report »

California’s Golden Energy Efficiency Opportunity Report

Date: August 20, 2015

California’s 40-year commitment to energy efficiency has saved Californians $90 billion on their utility bills, created hundreds of thousands of efficiency jobs, and will have avoided the pollution from 41 power plants by the end of the next decade, according to a report published by NRDC and E2. However, the report cautioned that a major efficiency ramp-up is necessary to meet the state’s long-term climate and energy goals.

View Report »

Sign Up for Email Updates


"*" indicates required fields

This field is for validation purposes and should be left unchanged.

Our Latest Press Releases


Releases

REPORT: Colorado clean energy sector grew by 4 percent, added 2K jobs in 2024

DENVER, CO (Dec. 10, 2025) – Clean energy jobs grew more than five times faster in Colorado than the rest of the state's economy in 2024, raising the total number of clean energy workers in the state to 69,859 – 18th most in the country – according to the s...


Releases

STATEMENT: Federal Rollback of Auto Fuel Efficiency Standards Will Increase Costs for Consumers, Businesses

The National Highway Traffic Safety Administration (NHTSA) is expected to announce the Administration’s intent to weaken federal Corporate Average Fuel Economy (CAFE) standards for vehicles. Such a dramatic shift in policy would halt five decades of progres...


Releases

Companies Cancel $4.4 Billion in Clean Energy Projects; $28 Billion, 30K Jobs Lost in 2025

WASHINGTON –Businesses canceled, closed, and scaled back more than $4.4 billion worth of large-scale factories and clean energy projects from late-September through October, bringing the total cost of projects cancelled in the private-sector to over $28.7 b...


Donate Today