Date: June 6, 2018
Missouri’s clean energy economy is clearly thriving.
But where is all this economic activity happening?
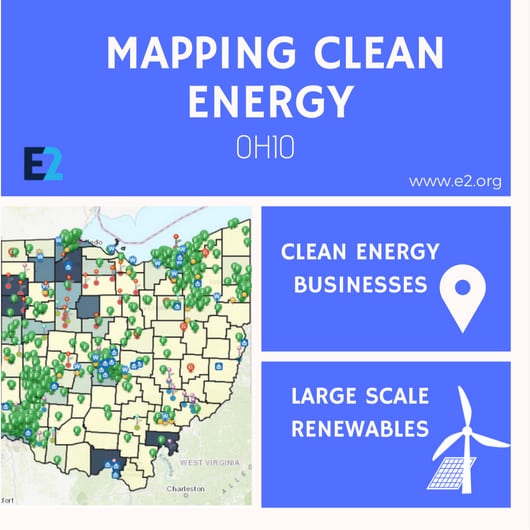
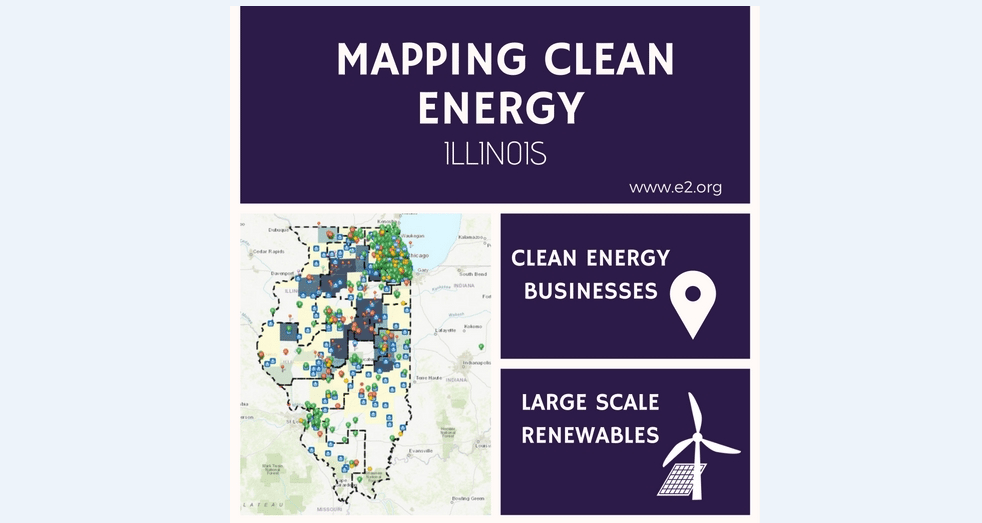
That’s exactly what E2 — along with our partners at FracTracker Alliance — attempted to find out with this series of interactive maps showing the location of more than 400 clean energy businesses across the state as well as sites where renewable energy is generated.
The purpose of these maps is to help policymakers, the media, and individuals better understand the scope of Missouri’s clean energy economy – and how much room it has to grow.
Key Takeaways:
- There are over 400 businessesdisplayed in the map, which includes energy efficiency contractors and renewable energy (solar, wind, and geothermal) installers, covering all 34 state senate districts.
- Approximately 75 percent of the state has above average potential for solar power
- There is 702 MW of utility-scale wind and solar capacity currently installed with 458 MW of wind and solar capacity proposed to be built.
We’ve done our best to capture as many businesses as possible but if you know we’ve missed something, please send an email to Micaela Preskill ([email protected]) and we’ll add it to the map. This map isn’t comprehensive; it represents one snapshot in time of an industry to help you understand just how robust it is, and where it still has room to grow.
How to Use the Maps:
We’ve created 3 maps to show different parts of Missouri’s clean energy economy. One map shows clean energy businesses, one shows renewable energy utility-scale infrastructure, and one shows renewable energy potential.
When viewing the map, zoom in to see the intricacies of what’s happening in each part of the state. If you click “Layers” on the black bar at the top of the map you will see a drop-down menu, which you can use to make data appear or disappear on the map.
For more information about what you’re seeing, click directly on the map. A pop-up box will appear to show you specifics. Use the arrows on the top right of the pop-up box to see all the information that applies to that spot on the map. For example, if you click on a pin representing a energy efficiency contractor, you’ll see information about that business. You can also use the arrow to see what legislative districts that business is in.
The Maps
The Clean Energy Business Map shows locations of energy efficiency contractors and solar, wind and geothermal installers.
The Renewable Energy Infrastructure Map shows utility-scale wind and solar generation facilities larger than 1 MW and schools with solar energy generation.
The Renewable Potential Map shows the potential for wind, geothermal and solar power generation.
Other Resources:
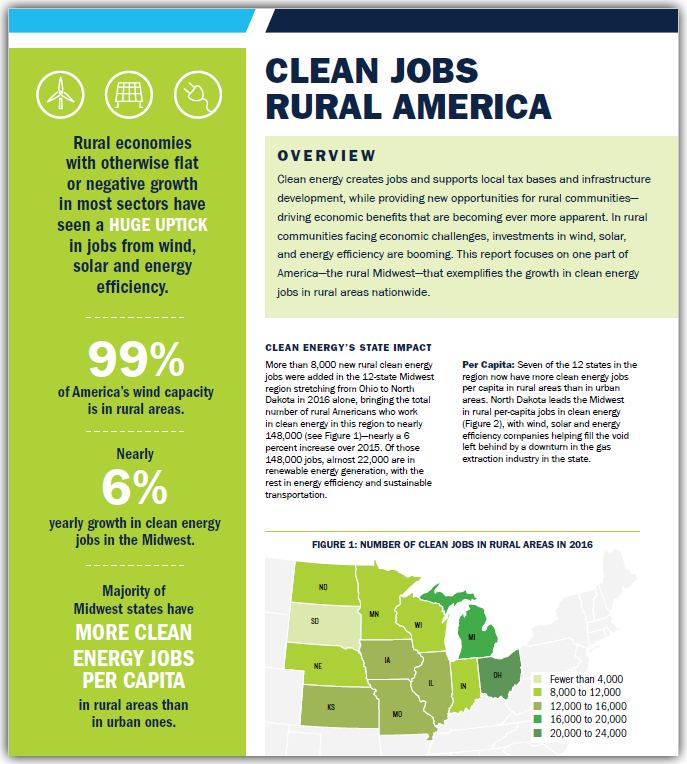
Missouri supports 55, 251 clean energy jobs – 2017 Clean Jobs Midwest Report
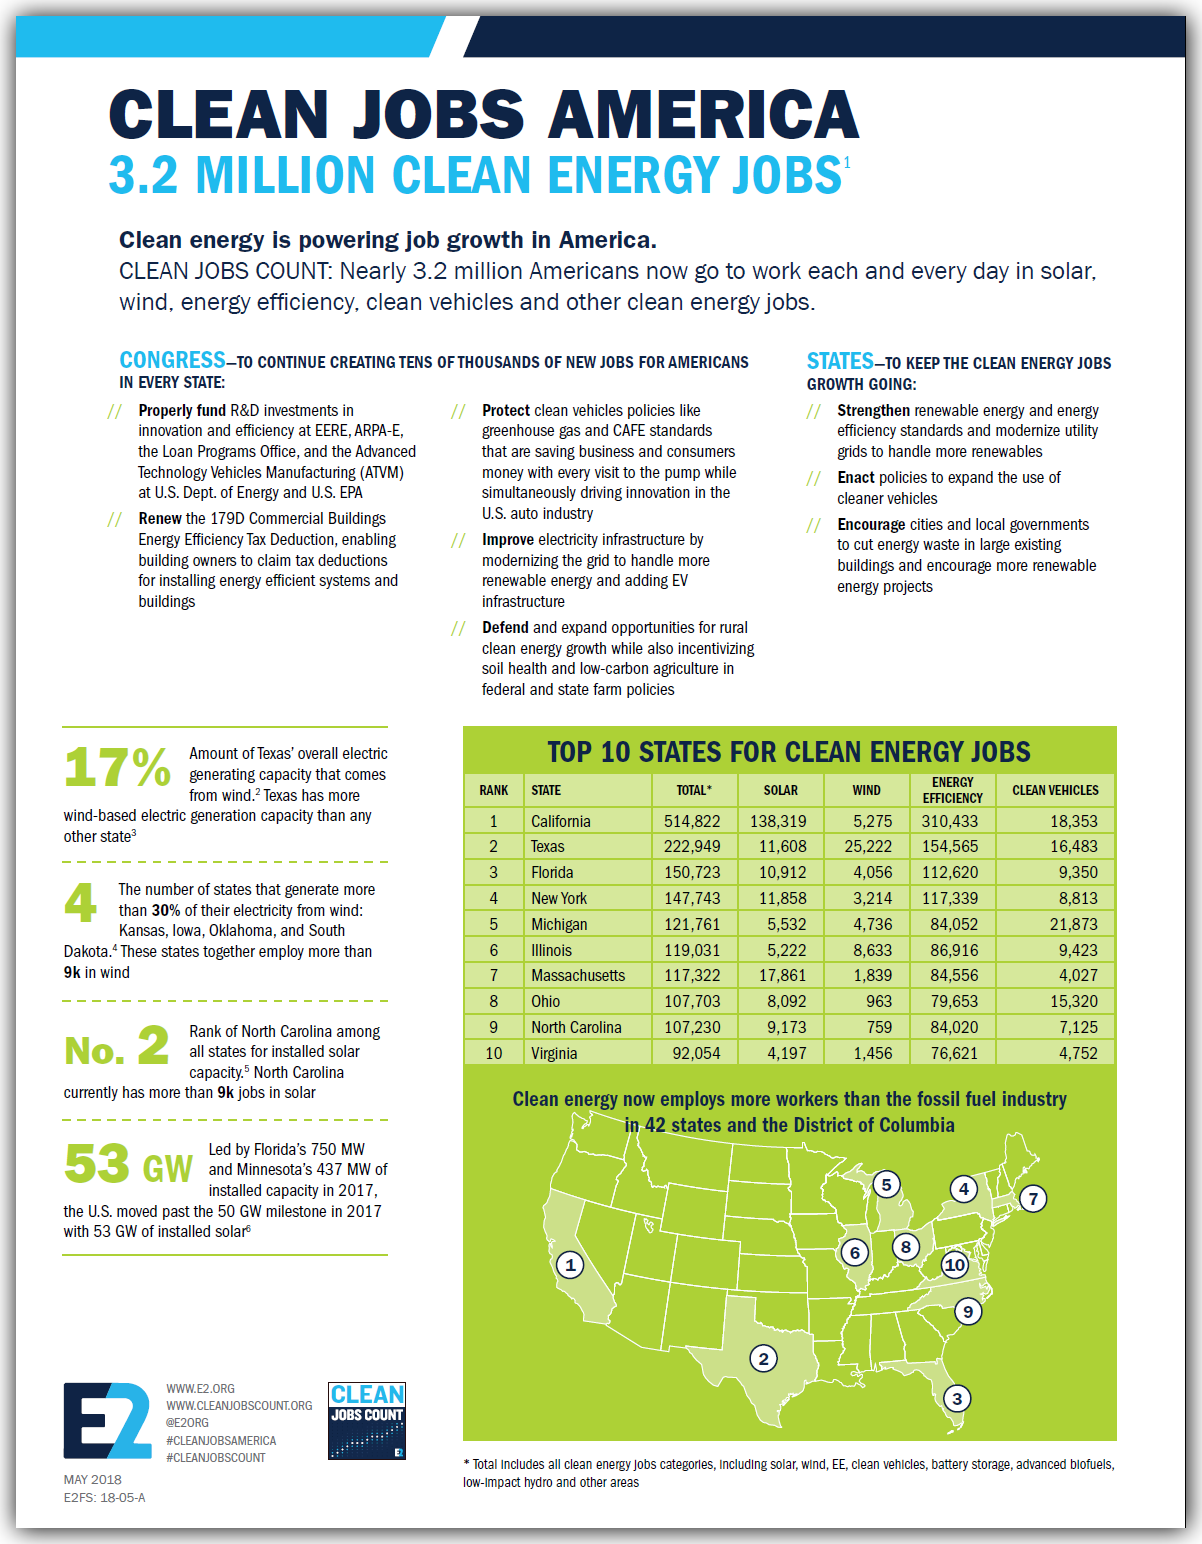
Nearly 3.2 million Americans work in clean energy – Clean Jobs America
View Report »