Getting the Lead Out: Employment & Economic Impacts of Lead Service Line Replacement

Date: August 3, 2021

Summary:

Based on the Biden administration’s plans to invest $45 billion to replace 100 percent of lead service lines in America, the findings from Getting the Lead Out: Employment & Economic Impacts from Replacing America’s Lead Service Lines, this report from E2 and the United Association of Union Plumbers & Pipefitters (UA) estimates that the $45 billion invested in this program will create and support 56,080 jobs annually for 10 years, or a total of 560,800 job-years. This annual estimate includes 26,900 direct jobs—construction workers, plumbers, pipefitters, heavy equipment operators—as a direct result of this activity. Another 13,600 jobs that last for 10 years are created throughout the value chain, and 13,800 jobs are created each year for 10 years as a result of workers spending their paycheck.

About 84 percent of all jobs created through this investment are in construction (52 percent), professional and business services (24 percent), and manufacturing industries (8 percent). Insofar as the bulk of these jobs involve high-skill construction occupations, the jobs created will provide good wages and training opportunities for local residents and promote economic benefits to affected communities.

This investment into cleaning up our nation’s water supply also would generate $38.3 billion in labor income, $11.7 billion in taxes, and $53.9 billion in additional value to the economy. That would represent a 120 percent return on investment.

In addition to the jobs created and value added to the economy from this activity, additional benefits like increased positive health outcomes would be generated. It has been estimated that an additional $22,000 of societal benefits are generated for every lead pipe replaced as a result of lower cardiovascular disease. Since in many areas lead service lines are more likely to exist in environmental justice communities, and since Black and Latino children have disproportionately high overall lead exposure, replacing these lead pipes will also greatly benefit low-income and minority households.

The scope of this work is massive and reaches every state. The Natural Resources Defense Council (NRDC) estimates that between 9.7 million to more than 12 million lead service lines are distributing water throughout our nation. About 700,000 or more of these service lines are found in Illinois, while Ohio, Michigan, New York, New Jersey Missouri and Wisconsin each contain more than 300,000 of the nation’s lead service lines; the top ten states total about 4 million.

This field is for validation purposes and should be left unchanged.

Findings

  • 560,800 total job-years*
  • $104 billion: total economic activity generated
  • 10 million lead service lines that need to be replaced

* 56,080 jobs annually over ten years

** Includes $38.3B in labor income, $11.7B in taxes and $53.9B in additional economic benefits

Methodology

BW Research used IMPLAN to conduct the economic impact analysis, resulting in the jobs, value-added, labor income, and taxes data. IMPLAN is an input-output modeling software that tracks spending patterns through the economy and their resulting impacts on economic indicators. The cumulative effects of the initial investment are quantified, and the results are categorized into direct, indirect, and induced effects. To capture interstate flows, direct and indirect impacts are results of national-level multipliers, distributed across states using state-level modeling. Induced impacts are the results of state-level multipliers, so as not to overestimate the impacts of household spending. Workforce data such as occupational demographics and wages are derived from JobsEQ by Chmura. JobsEQ is a workforce data software that derives data from Bureau of Labor Statistics and Census Bureau data, among other sources. Unionization rates are derived from unionstats.com.

  • Direct Impacts show the initial change in the economy associated with the investment. For example, pipefitters installing new service pipes or engineers planning the replacement.
  • Indirect Impacts include the supply chain responses as a result of the initial investment (i.e., water pipe manufacturers).
  • Induced Impacts refer to household spending and are the result of workers who are responsible for the direct and indirect effects spending their wages (i.e., direct and indirect workers spend income on clothes, food, healthcare, etc.).
  • Labor Income includes all forms of employment income, such as employee compensation (wages and benefits) and proprietor income (i.e. payments received by self-employed individuals and unincorporated business owners). Labor income is a component of value added.
  • Value Added is defined as the total value of production after netting out intermediate goods. This is another term for GDP.

About this Report

This economic impact analysis was conducted by BW Research Partnership for E2 in partnership with the United Association of Union Plumbers and Pipefitters. It uses the Biden Administration’s stated goal of 100 percent removal of lead service lines (LSLs) from America’s drinking water systems, the Natural Resources Defense Council’s (NRDC) national survey of LSLs, and the Environmental Protection Agency’s (EPA) estimated LSL replacement costs.

Special thanks to NRDC and BW Research. For a description of the methodology used in this report, please refer to the explanation on page in Appendix A.

Looking for More Info?

If you are looking for additional insight into Getting the Lead Out: Employment & Economic Impacts from Replacing America’s Lead Service Lines or E2’s other clean energy employment reports, visit e2.org/reports.

View Report »

E2 Action Alert: Support The California Climate Crisis Act (AB 1395)

Please review this E2 action alert letter and add your e-signature by using the fields below and clicking the ADD YOUR SIGNATURE button. Note that your are signing on as an individual and not as a representative of your employer.

Deadline to sign on is Sunday, August 15, 2021

Press Briefing: New Jobs Report on Replacing America’s Lead Pipes

In March, The Biden administration announced plans to remove 100 percent of America’s nearly 10 million lead service lines (LSLs) through the American Jobs Plan. A new report, from the national, nonpartisan business group E2 (Environmental Entrepreneurs) and the United Association of Union Plumbers and Pipefitters (UA), will detail the employment and economic gains if […]

RGGI Approval the “Right Choice” for NC’s Economy, Environment

Raleigh  – North Carolina’s Environmental Management Commission (EMC) today approved a petition for the state to begin the rulemaking process to join the 11-state Regional Greenhouse Gas Initiative (RGGI). The multi-state program curbs carbon emissions from power plants by placing a declining cap on CO2 emissions from the states’ electric power generation sector and reinvests […]

New legislation sets the table to grow cleantech industry in the Grand Valley

The Grand Valley Cleantech Business Coalition (CBC), with help from the Grand Junction Chamber of Commerce, Grand Junction Economic Partnership, Colorado Cleantech Industry Association, and E2-Environmental Entrepreneurs has doggedly followed the proceedings to identify bills that could bring immediate economic benefits to our region by stimulating its burgeoning Cleantech Industry.

EVs Are Not Only Great For The Environment, They Also Create Jobs

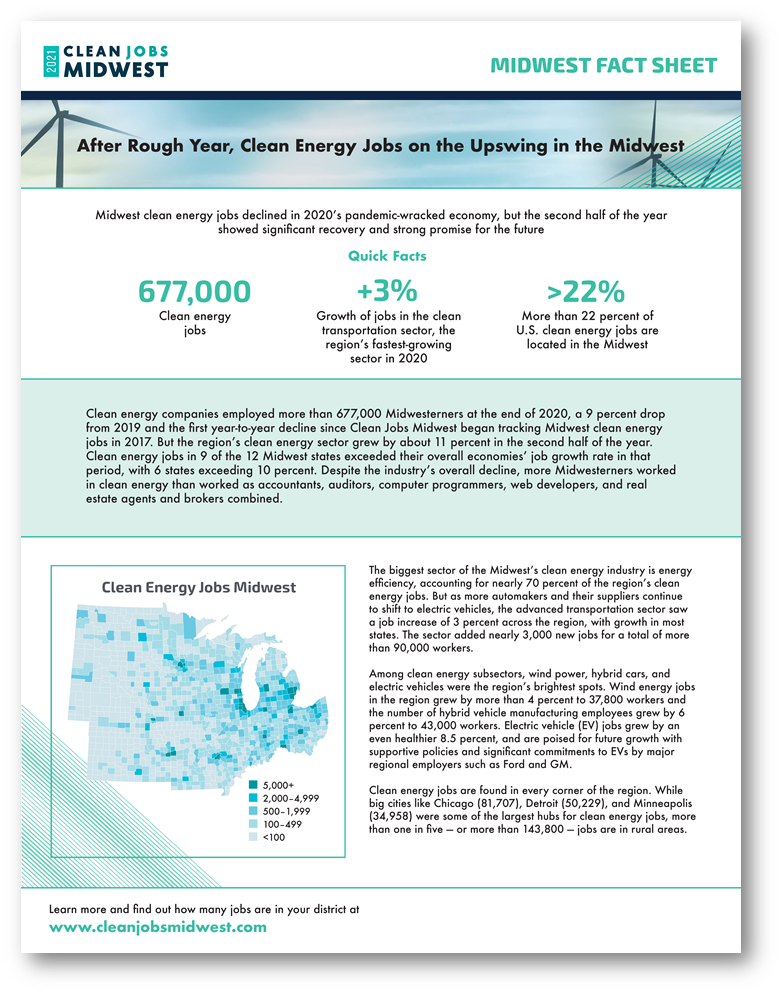
The 2021 Clean Jobs America’s Stats On EVs and Clean Energy Jobs According to the 2021 Clean Jobs Report, which looked at the previous year (2020), clean vehicle manufacturing jobs defied the overall energy sector job loss patterns and grew by nearly 3%. This was due to automakers shifting to cleaner and more efficient electric cars, […]

Equity & Workforce Development in the Clean Economy

Please join E2 for a national webinar discussion on access to clean energy job training. Before the pandemic, clean energy jobs were one of the fastest growing sectors of the economy, and will be a critical piece of how we build back better. But how do we ensure that clean energy employment opportunities are equitable? […]

The Demand for Clean-Energy Jobs Grows in Westchester

Here in New York, that comes as good economic news. The state ranks fourth in the nation in clean energy jobs (through 2019), according to research released by the nonpartisan business group E2. Westchester County is helping lead the way, with new companies popping up like spring tulips. And they need workers. The E2 report […]

Sign Up for Email Updates


"*" indicates required fields

This field is for validation purposes and should be left unchanged.

Our Latest Press Releases


Releases

House Republicans Launch Push to Reinstate Clean Energy Tax Credits

“Amid soaring electricity costs and tens of billions in clean energy projects getting cancelled and delayed across the country, this is a modest – but smart – step back in the right direction."


Donate Today